Test Data AC7-02
Airflow in the human upper airways
Application Challenge AC7-02 © copyright ERCOFTAC 2020
Test Data
Overview of Tests
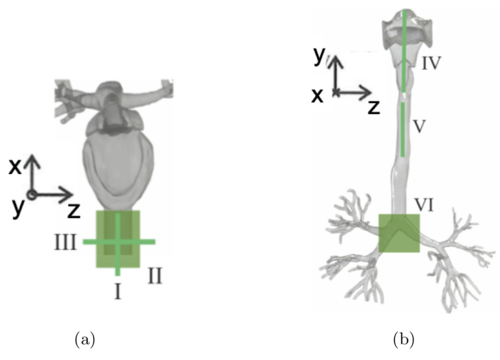
PIV measurements were performed at six different planes within the lung replica (see figure 6). The first three planes were located within the inlet tube with the aim to determine the exact inlet conditions. Plane IV corresponds to the central plane of the oral cavity and the pharynx. Note that this plane is tilted by from the exact vertical orientation. The larynx and the upper trachea were imaged by plane V, and plane VI covers the main bifurcation and bronchi. Both planes are vertical. For all of the measurement stations, the mean velocity and turbulent kinetic energy fields from the in-plane velocity components are determined (see section Evaluation and equations 8-11).

Description of experiment
The lung model was placed in an open liquid tank with a piston diaphragm pump attached to a linear actuator to achieve a quasi-stationary inspiratory flow. The stroke of the piston followed a cyclic triangular function with an adjustable falling constant slope and thus constant velocity to match different flow rates during inspiration. The employed working fluid is a mixture of water/glycerine (43:57 mass ratio, at ), which exactly matches the refractive index of the silicone model. Neutrally buoyant polyamide particles () were used as tracer particles (Stokes number Stk ≈ 0.002). Particle images were recorded using a CCD camera (pco.1600, PCO) with a resolution of 1600px x 1200px in double-frame mode. A total number of 688 image pairs were acquired for each measurement. Illumination was provided by a double-pulse Nd:YAG laser ( = 532nm, MinilitePIV, Continuum, 10 mJ per pulse). Images were evaluated by DaVis 8 (LaVision). The final grid size is 32 x 32px (planes I-III) and 16 x 16px (planes IV-VI), respectively, both with 50% overlap.
Boundary conditions
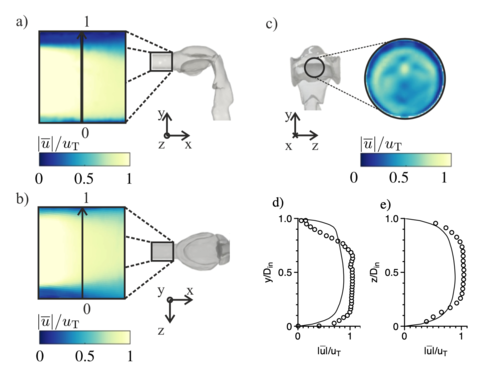
The mouth inlet and distal outlets of the lung model are open to the surrounding liquid. Thus liquid can enter and leave the model without any additional resistances or compliances. The local pressure at the mouth inlet corresponds to the barometric pressure plus the pressure of the water column above the model which is approximately 10cm. Accordingly, the pressure at the distal outlet increases by the additional water column which corresponds to the total model height of about 50cm. During inspiration, liquid is sucked into the model from the tank. The distance between tank's walls and the inlet of the model is about 15cm. The specific inlet conditions found in the experiment are presented in figure 7.

Measurement errors
For the experiments, the Reynolds similarity is calculated based on the properties of air at and atmospheric pressure, which results in a flow rate of = 31.75 L/min. This values has been used to program the linear actuator in order to provide the necessary main flow. At = 31.75 L/min, the experimental setup reaches its limit of the planned operation and a discrepancy between the targeted and actual occurring flow rate is observed. Thus, a maximum flowrate of = 28.56 L/min is achieved. This lowers the theoretical maximum Reynolds number from 4921 to 4286 but the flow still stays well within the turbulent regime. The reduction of the maximum Reynolds number occurs due to a leakage flow between the upper and lower part of the model. Consequently, the achieved flowrate within the main carina area is about 10% lower than in the upper part of the model. To account for this, we estimated the real flowrate based on the PIV data and recalculated the theoretical bulk velocity based on this estimate. This bulk velocity is then used as the correct scaling parameter for the results shown below. The measurement uncertainty of the displacement calculation for PIV is typically given as 0.1px (Adrian and Westerweel, 2011). With an adjusted mean displacement of around 8px this leads to a relative error of around 1.25% in the displacement calculation. Based on the proposed methods of Sciacchitano and Wieneke (2016) the statistical uncertainty of the derived mean velocity is around 0.05% and the statistical uncertainty of the turbulent kinetic energy estimation is around 3.
Measured data
The measured in-plane velocity and turbulent kinetic energy profiles at stations B-D and G,H,J (shown in figure 23 and 24), can be found in file PIV_profiles.xlsx.
Contributed by: P. Koullapisa, J. Muelab, O. Lehmkuhlc, F. Lizald, J. Jedelskyd, M. Jichad, T. Jankee, K. Bauere, M. Sommerfeldf, S. C. Kassinosa —
aDepartment of Mechanical and Manufacturing Engineering, University of Cyprus, Nicosia, Cyprus
bHeat and Mass Transfer Technological Centre, Universitat Politècnica de Catalunya, Terrassa, Spain
cBarcelona Supercomputing center, Barcelona, Spain
dFaculty of Mechanical Engineering, Brno University of Technology, Brno, Czech Republic
eInstitute of Mechanics and Fluid Dynamics, TU Bergakademie Freiberg, Freiberg, Germany
fInstitute Process Engineering, Otto von Guericke University, Halle (Saale), Germany
© copyright ERCOFTAC 2020


