Turbulent Blood Flow in a Ventricular Assist Device
Application Challenge AC7-03 © copyright ERCOFTAC 2021
Evaluation
Discretization Errors for Fluid Mechanical & Hemodynamical Parameters with URANS

Fig. 5.1. Pressure heads via the impeller (top). The line shows the fit

. Pressure heads via the VAD (bottom). The line shows the fit

. The error bars mark the numerical uncertainties (deviations in percent).
Figure 5.1. shows the discretization error uncertainties of the pressure headvia the VADs impeller and the whole pump. The error intervals of total pressure heads were up to 4.8% for the finest grid. From an engineering point of view, these uncertainties are in an acceptable range for the VAD design. In addition, the uncertainty for the pressure head for the whole VAD (4.8%) is higher than for the impeller alone (1.7%). The reason for this is that turbulent phenomena, e.g. detachment in the outlet guide vane, affect the pressure increase via the whole pump. Those effects may have a significant mesh sensitivity and thus affect the uncertainty of the pressure head for the entire VAD. Furthermore, the relatively small uncertainties for the pressure heads suggest that the finest grid resolution is enough to guarantee a grid-independent solution and no further grid refinement seems to be required for these results.

Fig. 5.2. Stress-dependent variables. Upper left: Volume in the pump which exceeds 9 Pa. The line shows the fit

. Upper right: Volume in the pump which exceeds 50 Pa. The line shows the fit

. Bottom left: Volume in the pump which exceeds 150 Pa. The line shows the fit

. Bottom right: Stress-dependent MIH value. The line shows the fit

.
The uncertainties for the stress-dependent MIH (Fig. 5.2, bottom right) indicates a higher but acceptable value for the finest grid with an  8% interval. In contrast, the coarsest grid has a two times higher uncertainty for MIH (15%) as the uncertainty for the pressure head (15%). On the other hand, the uncertainties of the volumes, which exceeds certain stress thresholds, indicate larger error intervals. These uncertainties are up to 4 times larger as the uncertainties for the pump characteristics, as can be seen in Fig. 5.2. In terms of a potential blood damage prediction with this shear stress field, these results indicate that the finest grid is still too coarse. Of course, the uncertainties of the different blood damage indicators will decrease with higher grid resolutions wherein the absolute values will converge to a final state, but even for grid UR-7 a decay of the slope of the fit in Fig. 5.2. is not obvious in the range of data obtained from the flow computations. Unless the grid size for the finest grid is already quite large for design and optimisation studies, it has still recognizable discretisation uncertainties for the shear-dependent variables, which are important for the blood damage evaluation.
Experimental Validation of URANS and LES
For simulations in turbopumps, hydraulic characteristics such as the head  are among the most important result variables. Also in the field of CFD applications in VADs, it is common to use the head to validate the numerical calculation. In fact, the measurement of the head is the only experimental validation of the numerical calculation in a large number of literature studies. Since the pressure in the pump is coupled via the governing equations to the rest of the flow field, the comparison of the heads can be used as the first stage of flow field validation in VADs.
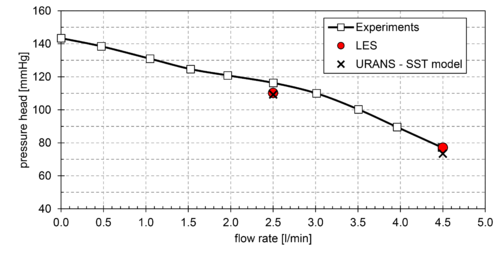
Fig. 5.3. Validation of the numerically calculated pressure heads
with experimental data. The figure shows the head curve for

.
The experimental and numerical results are given in Figure 5.3. For the operating point at  , a good agreement between numerics and experiment can be observed with a deviation of
  for LES and
  for URANS. For the smaller flow rate
  the deviation are slightly larger with
  for LES and
  for URANS.
In summary, the discrepancy between numerically and experimentally determined head is still within an acceptable range for both LES and URANS. From this, it can be concluded that the numerical model is valid to reproduce the real pressure buildup of the VAD.
Fluid Mechanical & Hemodynamical Evaluation of URANS
Hydraulic Efficiencies 
The hydraulic efficiencies of the impeller (index:  ) and the whole pump (index:
  ) are plotted in Tab. 5.1. The deviation between the URANS and the reference LES case are minor for both operation points with a maximal deviation of
  . It can be concluded that the turbulence-modelling URANS method can reflect the efficiencies, and hence the global losses, as accurately as the turbulence-resolving LES method.
Table 5.1 Hydraulic efficiencies of the impeller and the whole pump.
| Flow Rate |
Parameter |
LES |
URANS |
Relative deviation to LES [%]
|
|
![{\displaystyle \eta _{h,i}~[\%]}](https://en.wikipedia.org/api/rest_v1/media/math/render/svg/cd1722f15c7ba77407aba3cd8c41c4896331049f) |
 |
 |

|
|
|
 |
 |

|
|
![{\displaystyle \eta _{h,p}~[\%]}](https://en.wikipedia.org/api/rest_v1/media/math/render/svg/82fa41058dc95112e6f771036960ba7c6a4d2b39) |
 |
 |

|
|
|
 |
 |

|
Equivalent Shear Stresses 
The computed equivalent stresses are plotted for both operation points in Fig. 5.4. The stresses from the reference LES are compared to the URANS computations with stress formulations (Eq. (6.1) and (6.2) in the Description) with and without the contribution of the modeled parameter  . As can be seen from the LES results, relevant stresses above 9 Pa (threshold for vWF degradation) and 50 Pa (platelet activation) are present within the flow channel of the rotor and the outlet guide vane. These stresses are significantly underresolved, when a stress formulation is used, which do not account for the modeled contribution (w/o
  ). With inclusion of , the stresses are closer to the LES results. Especially for partial load (), similar results are observable. Greater deviations in computed stresses are noticable for the nominal load point between LES and URANS. Despite the URANS can reflect the high stresses in the gap vortex and the trailing edge flow regions (red areas), the relevant regions in the blade channels cannot be adequately reflected. In the blade channel, complex interactions between secondary flows (explained in the Description section) occur, which are directly resolved by the LES. On the other side, the URANS turbulence model cannot adequately model the impact of these complex flow interactions on the turbulent stress field.

Fig. 5.4. Equivalent stresses
of LES and URANS. The equivalent stresses with and without the contribution from the turbulence model
is included. The figure displays a cylindical cut through the rotor and outlet guide vane at a radius of 80% of the outer radius

. Top row: partial load at
. Bottom row: nominal load at
.
Hemodynamical Evaluation: Hemolysis Value  and Volumetric Threshold Analysis
The computed MIH-values are shown in Table 5.2.
Table 5.2 Modified index of Hemolysis .
| case |
nominal load |
partial load
|
| LES - reference |
 |

|
URANS  |
 |

|
URANS  |
 |

|
Table 5.3 Analysis of volumes  , which exceeds the thresholds for vWF degradation (>9 Pa), platelet activation (>50 Pa) and hemolysis (>150 Pa), at partial load.
| |
![{\displaystyle I_{\tau _{eff}>9~Pa}~[\%]}](https://en.wikipedia.org/api/rest_v1/media/math/render/svg/aca0a3d2898581851afd6da764e5d1d5a61dcb78) |
![{\displaystyle I_{\tau _{eff}>50~Pa}~[\%]}](https://en.wikipedia.org/api/rest_v1/media/math/render/svg/c83af4cdc77065d07063238c073072f223569397) |
![{\displaystyle I_{\tau _{eff}>150~Pa}~[\%]}](https://en.wikipedia.org/api/rest_v1/media/math/render/svg/8a1cf8e564ceba2182e9d25106615ae457800f11)
|
| LES - reference |
 |
 |

|
| URANS |
 |
 |

|
| URANS |
 |
 |

|
Table 5.4 Analysis of volumes , which exceeds the thresholds for vWF degradation (>9 Pa), platelet activation (>50 Pa) and hemolysis (>150 Pa), at nominal load.
 |
|
|
|
| LES - reference |
|
|
|
| URANS |
|
|
|
| URANS |
|
|
|
Contributed by: B. Torner — University of Rostock, Germany
© copyright ERCOFTAC 2021


