UFR 3-10 Test Case
The plane wall jet
Underlying Flow Regime 3-10 © copyright ERCOFTAC 2004
Test Case
Brief description of the study test case
The basic flow field that has been studied is the two-dimensional wall jet on a plane surface, and more specifically "the plane wall jet in still air" according to the terminology used by Launder and Rodi (1981). There are, however, variations also on this subsection of the wall jet. These variations concern the design of the wall above the inlet. This wall is usually either a thin lip, used e.g. in the experiment by Wygnanski et al. (1992), or an "infinite" vertical wall as in the present experiment. The latter design is simpler to treat computationally, since it, together with a "no inflow" - upper boundary, results in a single, well-defined inflow boundary with known boundary conditions. It was therefore chosen here, in spite of the inevitable return flow that this configuration generates, a return flow which far downstream of the nozzle changes the character of the jet.
An important criterion in the experimental design was that the spatial resolution should be sufficiently high to allow the wall shear stress to be determined directly from mean velocity measurements. This imposes an upper limit on the ratio of measuring control volume diameter to viscous length scale, but a high enough inlet Re-number must also be retained to allow comparisons with earlier studies. Once water was chosen as the working fluid, due to the absence of seeding problems in low-speed water flows, these considerations led to the present combination of slot width and inlet velocity.
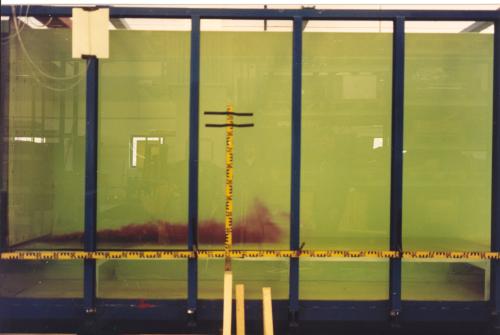
The test facility is shown in Figure 3. The test section consists of a large tank into which a jet discharges horizontally along the bottom, through a slot. The tank is 7 m long and its width is 1.45 m, with a free water surface. One of the side walls is made of glass, as well as the bottom. Using a glass bottom improves the conditions for near-wall measurements, since its smoothness minimizes the diffuse surface reflections (Johnson & Brown, 1990).
Before the repeat experiment, the test section had to be modified to achieve optical access for the measuring of the spanwise velocity component. Originally, the space between the bottom of the test section and the bottom of the tank was water-filled to decrease the load on the test section glass bottom. A large, slightly oval “box”, open at its top and bottom, was now fitted into this space and sealed against the surrounding water. Thus a dry space was created immediately under the test section, in which a fiberoptic probe with traversing equipment could be placed. The size and position of the box was restricted both by the positions of the load-bearing beams under the water tank and those under the glass bottom. As a consequence, it was not possible to make spanwise velocity measurements on the centerline.


Figure 3. Wall jet test facility. a) test section during preliminary flow visualization. b) side view of test facility.
The slot height was measured with water in the tank, by a diver. The results showed the slot height to be 9.6 ± 0.1 mm over most of the slot width, giving a jet width-to-height-ratio of 151 [3] . This was considered large enough to obtain good two-dimensionality. A large contraction (Morel, 1975, 1977) with a turbulence-reducing screen inserted is used to produce a fairly flat mean velocity profile at the inlet. A weir upstream of the contraction keeps the upstream water level constant, and the flow velocity through the slot is set by an adjustable weir at the downstream end at the tank. This reference velocity is determined as U0 = (2gΔh)1/2,where Δh is the difference in height between the upstream and downstream free surfaces.
The inlet velocity, U0, was set as close as possible to 1 m/s, corresponding to a water depth downstream of the inlet of about 1.4 m. For this water depth, the influence of the recirculating flow on the growth rate of the jet was negligible for the first 150 slot heights.
Using water of approximately room temperature, one obtains a nominal inlet Re-number Re0 = U0b/ν ≈ 9.6 × 10³, which is sufficiently high to be comparable to previous experimental studies, e.g. Bradshaw & Gee (1960) and Tailland & Mathieu (1967).
Instrumentation
TSI LDV hardware was used for all experimental work. Conventional optics was used for the two-component experiment, whereas a fiberoptics system was used in the repeat experiment. In both experiments, an upper-central beam arrangement was used to measure the normal velocity component (V), see Karlsson & Johansson (1988). Standard TSI software was used for data collection and initial data reduction. Silicon carbide particles with a mean diameter of 1.5 μm was used to uniformly seed the flow.
The development of experimental methodology and data treatment was a necessary and integral part of the work. This was primarily driven by the objective of high quality near-wall turbulence measurements. The objective of simultaneous 3-component measurements was also a contributory cause. This part of the work is most thoroughly covered in a series of internal reports; Eriksson et al. (1997), Eriksson (2000), Eriksson (2002). Supplementary information is given in Eriksson & Karlsson (2000).
The first experiment was performed using a modified two-colour system (TSI 9100-7) together with 1980 counter signal processors and frequency shift modules. The system was modified as to increase the beam expansion ratio to 8.5 by including an extra beam expansion module. A front lens with a focal distance of 750 mm was used, in order to reach the centreline of the tank. The probe volume dimensions, based on the e-2 intensity cutoff point, were (0.73 × 0.05) mm (streamwise velocity component - 488 nm) and (1.60 × 0.05) mm (normal velocity component - 514.5 nm), respectively.
The repeat experiment hardware consisted of a Colorburst for frequency shifting and colour separation, six fiberoptic couplers, two 2-component fiberoptic probes, a Colorlink including receiving optics and frequency mixing electronics, and a 3-component IFA750 signal processor. The fiberoptic probe used to measure the streamwise and normal velocities was equipped with an extra 2.6x beam expander. A front lens with a focal distance of 450 mm was used. (Enough to reach the spanwise positions where 3-component measurements were possible, while still giving small probe volumes.) The resulting probe volume dimensions, based on the e-2 intensity cutoff point, were (0.37 × 0.038) mm (streamwise velocity component - 488 nm) and (0.78 × 0.040) mm (normal velocity component - 514.5 nm), respectively. The probe used to measure the spanwise component had no extra beam expansion. The front lens focal distance was 250 mm, resulting in a (0.74 × 0.054) mm measuring volume (476 nm).
The optical parameters at x/b = 70 are summarized in Table 1. The ratio of probe volume diameter to viscous length scale (dpv/l+) is included. It is seen that dpv ~ 1 viscous unit at this streamwise position. Since l+ increases with increasing x/b, the spatial resolution will improve accordingly. (And vice versa for decreasing x/b.)
Optical set-up
The probe used to measure the spanwise component was mounted vertically on a one-axis traverse system positioned under the test section. All three-component measurements were made using light collection in 90° side-scatter (scattered light from probe 1 collected through probe 2 and vice versa), meaning that the length of a measuring volume was significantly shorter than the length of the corresponding probe volume; lmv << lpv. For the optics used,lmv isreduced to approximately two times the diameter of the orthogonal probe volume. Avoiding direct backscatter light collection does also improve the signal-to-noise ratio for all velocity components close to the wall, due to less stray reflections from interfaces between media with different refractive indices.
Figure 4 shows the experimental set-up for the three-component measurements, but is also useful for illustrating the two-component set-up since the latter is obtained simply by excluding probe 2 and traverse system 2 (and substituting conventional optics for probe 1). A three-axis traverse table was positioned in front of the test section. When running the two-component experiment, the entire LDV system was mounted on this traverse table, Consequently, backscatter light collection was used. For the repeat experiment, the traverse table was used to traverse the fiberoptic probe measuring the streamwise and normal velocities.
Figure 4. Cross-section of wall jet test facility showng experimental set-up for three-component measurements (indicated water depth not to scale).
|
Normal velocity |
Streamwise velocity |
Spanwise velocity | ||
|
Two-component experiment |
λ (nm) |
514.5 |
488 |
|
|
dpv (μm) |
49 |
46 |
||
|
lpv (mm) |
1.20 |
0.55 |
||
|
Fringe distance (μm) |
6.18 |
2.89 |
||
|
dpv/l+ |
1.19 |
1.12 |
||
|
|
||||
|
Three-component experiment |
λ (nm) |
514.5 |
488 |
476 |
|
dpv (μm) |
40 |
38 |
54 | |
|
lpv (mm) |
0.78 |
0.37 |
0.74 | |
|
Fringe distance (μm) |
3.76 |
1.80 |
2.48 | |
|
dpv/l+ |
0.99 |
0.94 |
1.33 | |
|
|
Test Case Experiments
The papers by Eriksson et al. (1998) and Karlsson et al.(1993 a, b) are the main experimental papers and contain the data which constitute the data bank contribution. The database is available from the ERCOFTAC classic collection. They give a complete account of mean velocities and turbulence quantities up to second order from the two-component experiment, including initial conditions, growth rate and decay of streamwise mean velocity. Measurements were taken at x/b = 5, 10, 20, 40, 70, 100, 150 and 200, so data from the initial development as well as from the fully developed flow is included. The data are shown to fulfil the two-dimensional momentum equation up to x/b = 150, thereby producing strong evidence for the two-dimensionality of the flow as well as for the internal consistency of the measurements. The data are also compatible with the two-dimensional continuity equation, given the difficulties making correct measurements of the normal mean velocity.
The most important results from these papers are the inner layer measurements.To the best of the authors knowledge,these are the first turbulence data ever published for the near-wall region of the turbulent wall jet. It is also, we think, the first correct direct wall shear stress measurements.
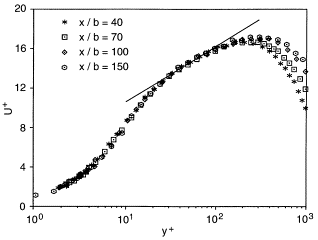
A very important feature is the well resolvednear-wall layer. It is seen from Figure 5 that U was measured down to y+ = 1 – 2. This resolution is necessary if τw is to be determined from measurements of the velocity gradient at the wall, since U+ is linear in y+ out to y+ = 3 – 4, only. The collapse of the profiles gives credibility to the wall shear stress measurements since any non-systematic errors in these measurements would tend to pull the profiles apart.

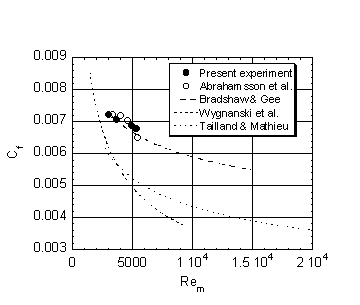
Figure 6 shows local skin friction coefficients versus Rem = Umym/ν. The correlation proposed by Bradshaw & Gee (1960), and recommended by Launder & Rodi (1981), is shown for comparison, as well as data from Abrahamsson et al. (1994), Wygnanski et al. (1992) and Tailland & Mathieu (1967). The present data is in the range of the Bradshaw & Gee correlation in the limited range of Re-numbers studied, but shows a different Re-number dependence. They are also in reasonable agreement with the data of Abrahamsson et al. (Preston tubes). In partial contrast to this, LR81 noted that the then existing determinations of Cf based on direct measurements of the velocity gradient at the wall produced values ranging from 20% to 35% below the consensus of the impact-tube data. The data from Wygnanski et al. (1992) and Tailland & Mathieu (1967) do show considerably lower skin friction coefficients than the present investigation. In both those investigations, Cf was determined from hot-wire measurements of the mean velocity near the surface, but using considerably larger values of y+ for the estimation.

It is inferred from the momentum equation that the velocity maximum and the half-width is related through the condition Um ~ (y1/2)n. Available experiments suggest that n may be universal. It is argued using the similarity form of the momentum equation that -n > 1/2. It follows from similarity arguments that as a consequence, y1/2 must grow slower than linearly with x. Based on available experimental data, the asymptotic ![]() variation is shown to be nearly linear, but not quite, the exponent being 0.97 (George et al. 2000).
variation is shown to be nearly linear, but not quite, the exponent being 0.97 (George et al. 2000).
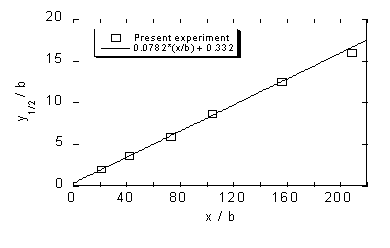
Following the evaluation of Eriksson et al. (1998), assuming linear growth, the growth rate of the wall jet, defined as dy1/2/dx, is shown in Figure 7. The value from this experiment is
dy1/2/dx = 0.078 (x/b) + 0.332,
which is in good agreement with the value 0.075 from Launder and Rodi (1981).

Figure 7. Growth rate of wall jet. Linear relation assumed.
Design or Assessment Parameters ([../../help/glossary.htm DOAP]:s)
The three most important design or assessment parameters regarding the gross behaviour of the turbulent wall jet are:
- The local skin friction coefficient Cf
- The growth rate dy1/2/dx
- The distribution of the turbulent kinetic energy, k
These parameters can be extracted from computations with simple two-equation models and can thus be compared to the experimental data. The experimental distribution of k at the streamwise position x/b= 70 is shown in Figure 8. [4]
|
a) |
b) |
Figure 8. Turbulent kinetic energy of the wall jet in inner scaling. a) Entire profile. b) Near-wall region.
For validation of computations performed with more advanced turbulence models, Reynold-stress models, experimental data on all Reynolds stresses are required. The three normal stresses, given as turbulence intensities, are shown in Figure 9. The turbulent shear stress is shown in Figure 10. Additional [../../help/glossary.htm DOAP]:s, useful for validation of Reynolds-stress model computations are thus
- The three turbulence intensities u´/u*, v´/u*, and w´/u*
- The turbulent shear stress distribution.
It should be mentioned here that the leading terms in the near-wall series expansions of the Reynolds stresses, the turbulent kinetic energy, and the dissipation rate at the wall, are given for x/b=70 in Eriksson (2003). These data might prove very useful for validation of Reynolds stress models.
Figure 9. Turbulence intensities u'/u*, v'/u*, w'/u*, at x/b=70
Figure 10. Turbulent shear stress distribution in inner scaling, x/b=70.
CFD Methods
The first computation of the present test case was published by Andersson et al. (1993). They presented results for a standard k-ε model and for a RSM model, using wall functions in both cases.
The plane turbulent wall jet has been a test case (5.1) at two ERCOFTAC/IAHR Workshops on Refined Flow Modelling (5th workshop 1996 in Chatou, Paris, April 25-26, editors: I. Dathieu, D. Laurence, S. Richoux, and 6th Workshop 1997, in Delft, 6-7 June, editors: K. Hanjalic, S. Obi.).
Twelve different groups submitted altogether 35 computations to the 5th workshop in Paris. Of these, 14 were based on k-ε, 2 were k-ω, 3 ARSM , 8 RSM, and the rest special formulations. A description of numerical methods and models is given in Vol. I of the Proceedings. For a summary see Table 2.
Table 2: Participants, numerical and model information for the 5th Workshop, the plane wall jet (case 5.1)
Results in the form of mean velocity profiles, profiles of fluctuating velocity and k, L and ![]() profiles, as well as profiles of Umax and Cf were given in Vol. III of the proceedings and compared with experimental data.
profiles, as well as profiles of Umax and Cf were given in Vol. III of the proceedings and compared with experimental data.
In Workshop 6, eight participating groups submitted 19 different computations. 8 were based on the k-ε model, some of which had near-wall modifications, 1 on the k-ω model, 9 on RSM and 1 on ASM. Here the emphasis in the evaluation of results was on self-similarity checks of mean velocity and turbulence intensity profiles. A summary of the participation in Workshop 6 is given in Table 3.
Table 3. Participants, numerical and model information for the 6th Workshop, the plane wall jet (case 5.1)
Details on computational procedures are given in the proceedings and will not be repeated here, although computational mesh, turbulence models and some information about code and computational procedure are listed in Tables 2 and 3. The size of the computational grid varies between 46*46 nodes to 326*217 nodes. It is therefore safe to say that not all computations are grid-independent, although some authors showed results on different grids and claimed that grid-independence was achieved.
The test case was designed to provide simple inlet and outlet boundary conditions with only one inflow boundary and one outflow boundary. The measured inlet boundary conditions are, however, not complete, since only one mean velocity component and one fluctuating velocity was measured. Here some authors have performed sensitivity checks to see how various choices of k and epsilon at the inlet boundary affect the results.
The simple boundary conditions were achieved at the penalty of a large flow facility. In order to save computational time, some authors truncated the computational domain, thereby again introducing the need to redefine (and approximate) the boundary conditions.
In addition to the Proceedings, Hemström (1995) has reported on using commercial codes with the standard k-ε model for the wall jet. Besides participating in the workshop 1997, Gerodimos and So (1997) also published a more complete study on the same subject.
© copyright ERCOFTAC 2004
Contributors: Jan Eriksson; Rolf Karlsson - Vattenfall Utveckling AB


