Evaluation AC1-01
Aero-acoustic cavity
Application Challenge 1-01 © copyright ERCOFTAC 2004
Comparison of Test data and CFD
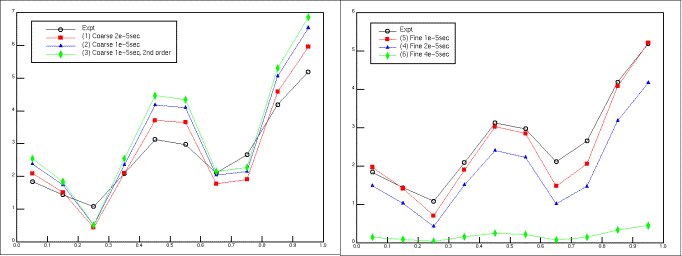
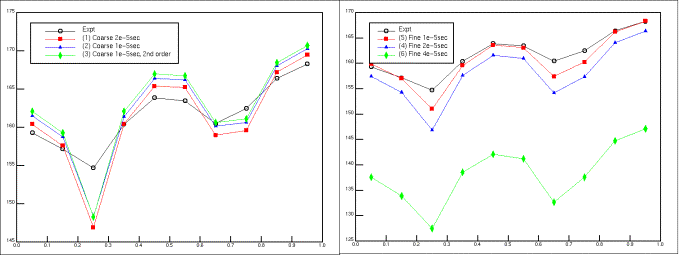
Time step sizes have been varied between 4.e-5 and 1.e-5 seconds. For the coarse and fine meshes, the CFD results and comparisons with experiment are presented below in the form of Prms (Figure 5) and sound pressure level, dB (Figure 6) plotted at the 10 measurement points along the cavity floor.
Figure 5: Prms along the cavity floor – coarse mesh (left) and fine mesh (right)
Figure 6: Sound Pressure Level (SPL) along cavity floor – coarse (left) and fine mesh (right)
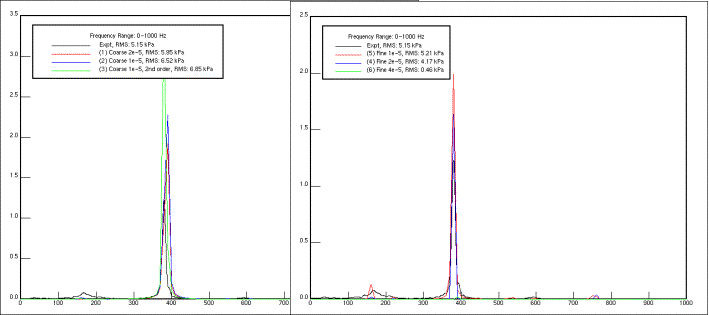
Fourier analysis of the CFD pressure signals for all measurement points indicate that the predictions correctly capture four acoustic tones, three of which are broad band and a dominant narrow band mode. The power spectral density plots are typified by Figure 7 below for node 10.
Future work will concentrate on the following areas
- 3D calculations (assessment of run times and accuracy in anticipation of )
- Assessment of alternative turbulence models
- Optimization of grid and time-step settings.
Figure 7: PSD vs. frequency for node 10 – coarse mesh (left) and fine mesh (right)
© copyright ERCOFTAC 2004
Contributors: Fred Mendonca; Richard Allen - Computational Dynamics Ltd
Site Design and Implementation: Atkins and UniS


