UFR 4-09 References
Confined buoyant plume
Underlying Flow Regime 4-09 © copyright ERCOFTAC 2004
References
Abbas, T. 1999 Displacement ventilation and static cooling devices. BSRIA Code of Practice 17/99.
AEA 1995 Computational Fluid Dynamics Services CFX 4.1 Flow Solver. User Guide (Harwell: AEA)
Chen, Q. & Srebric 2000 Application of CFD tools for indoor and outdoor environment design. Intl. J. Architect. Sci. 1(1), 1429.
Cook, M.J. 1998 An evaluation of computational fluid dynamics software for modelling of buoyancy-driven displacement ventilation. PhD Thesis. De Montfort Univ., Leicester, UK.
Cook, M.J. & Lomas, K.J. 1997 Guidance on the use of computational fluid dynamics for modelling buoyancy-driven flows. Proc. IBSPA. Vol. 3. ISBN. 80-01-01646-3.
Cook, M.J. & Lomas, K.J. 1998 Buoyancy-driven displacement flows: Evaluation of two eddy viscosity turbulence models for prediction. Proc. CIBSE A: Building Serv. Eng. Res. Technol. 19(1) 1521.
Cook, M.J., Ji, Y. & Hunt, G.R. 2003 CFD Modelling of natural ventilation: combined wind and buoyancy forces. Intl. J. of Ventilation 1, No. 3, pp. 169180.
Cooper, P. & Linden, P.F. 1996 Natural ventilation of an enclosure containing two buoyancy sources. J. Fluid Mech.311, 153176.
Holford, J.M. & Hunt, D.G. 2001 The dependence of the discharge co-efficient on density contrast experimental measurements. Proc. 14th Australasian Fluid Mech. Conf. 1014 December 2001.
Howell, S.A. & Potts, I. 2002 On the natural displacement flow through a full-scale enclosure and the importance of the radiative participation of the water vapour content of the air. Building and Environment 37, 817823.
Hunt, D.G. & Holford, J.M. 2000 The discharge co-efficient experimental measurement of dependence on density contrast. Proc. 21st AIVC Ann. Conf. 2629 Sept. 2000, paper 26.
Hunt, D.G. & Kaye, N.G. 2001 Virtual origin correction for lazy plumes. J. Fluid Mech.435, 377396.
Hunt, D.G. & Linden, P.F. 1999 The fluid mechanics of natural ventilation displacement ventilation by buoyancy-driven flows assisted by wind. Building and Environment.34, 707720.
Hunt, D.G. & Linden, P.F. 2001 Steady-state flows in an enclosure ventilated by buoyancy forces assisted by wind. J. Fluid Mech.426, 355386.
Lane-Serff, G.F. 1989 Heat flow and air movements in buildings. PhD thesis. University of Cambridge.
Launder, B.E. & Spalding, D.B. (1974) The numerical computation of turbulent flows. Computer Methods in Applied Mechanics and Engineering 3 p. 269289. Linden, P.F. 1999 The fluid mechanics of natural ventilation. Ann. Rev. Fluid Mech. 31, 201238.
Linden, P.F. 1999 The fluid mechanics of natural ventilation. IAnn. Rev. Fluid Mech. 31, 201238.
Linden, P.F. & Cooper, P. 1996 Multiple sources of buoyancy in a naturally ventilated enclosure. J. Fluid Mech.311, 17792.
Linden, P.F., Lane-Serff, G.F. & Smeed, D.A. 1990 Emptying filling boxes: the fluid mechanics of natural ventilation. J. Fluid Mech.212, 309335.
Morton, B.R., Taylor, G.I. & Turner, J.S. 1958 Turbulent gravitational convection from maintained and instantaneous sources. Proc. R. Soc. Lond A234, 123.
Turner, J.S. 1973 Buoyancy effects in fluids. Cambridge University Press.
Woolf, D.R.S. 1994 CFD simulation of swirl jet displacement ventilation systems, Proc. European Conference on Energy Performance and Indoor Climate in Buildings, Lyon, France, 1994.
Woolf, D.R.S. 1995 Physical and numerical modelling of swirl jet displacement ventilation systems. PhD thesis. University of Leeds, UK.
Yakhot, V., Orzag, S.A. , Thangham, S., Gatski T.B., & Speziale, C.G. 1992 Development of turbulence models for shear flows by a double expansion technique. Phys. Fluids. A 4(7) 15101520
List of Figures
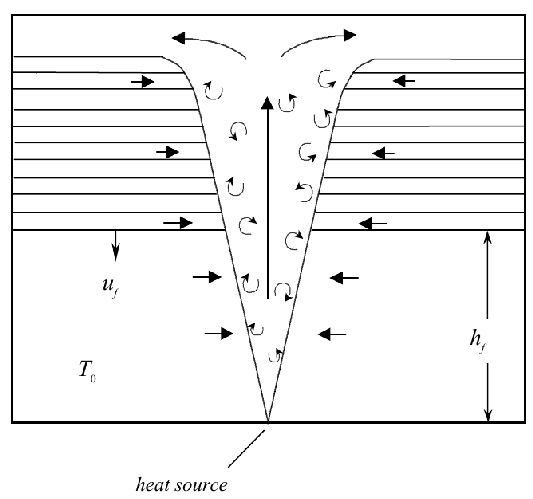
Figure 1. Schematic of the ‘filling box’ flow. Buoyant fluid rises vertically in the plume then collects in the upper part of the space forming a stratified layer (the horizontal lines represent constant density surfaces in the stratified layer). The leading ‘front’ of the stratified region, at height hf, descends at speed uf , until reaching the floor after some time. The plume entrains fluid from both the homogeneous and stratified regions. In the latter region, the entrainment produces a horizontal flow along constant density surfaces towards the plume. After the front has reached the floor, the stratification weakens and eventually the whole space becomes well mixed. Originals of all the figures in this UFR are in UFR4-09_Figures.pdf

Figure 2. Definition sketch and schematic of the ‘emptying-filling box’ flow. Air at temperature T0 enters the space through the bottom opening, of area ab. The plume carries buoyant fluid from the plume source together with entrained ambient fluid into the upper layer. On reaching the upper layer the plume dissipates and maintains well-mixed conditions in the upper the layer at temperature T0+ΔT. The interface between the two layers, at height h is quite sharp. Warm air in the upper layer leaves through the top opening, of area at. Originals of all the figures in this UFR are in UFR4-09_Figures.pdf
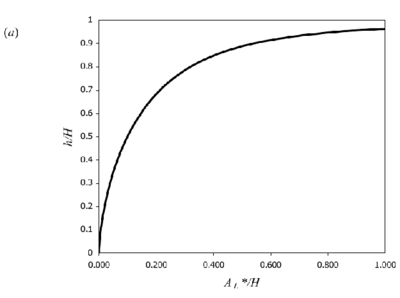
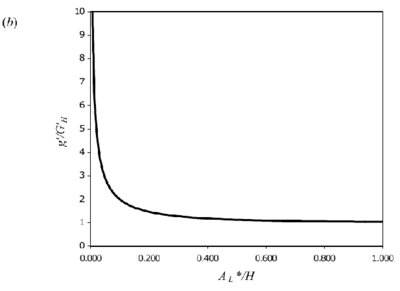
Figure 3. Theoretical curves for 2D line-source plumes for a) interface height and (b) reduced gravity (equations 5 & 7). Originals of all the figures in this UFR are in UFR4-09_Figures.pdf
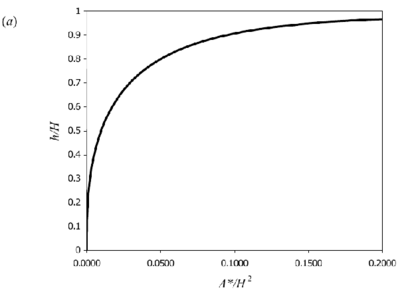
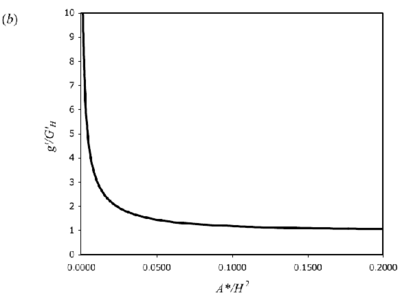
Figure 4. Theoretical curves for 3D point-source plumes for a) interface height and (b) reduced gravity (equations 8 & 10). Originals of all the figures in this UFR are in UFR4-09_Figures.pdf
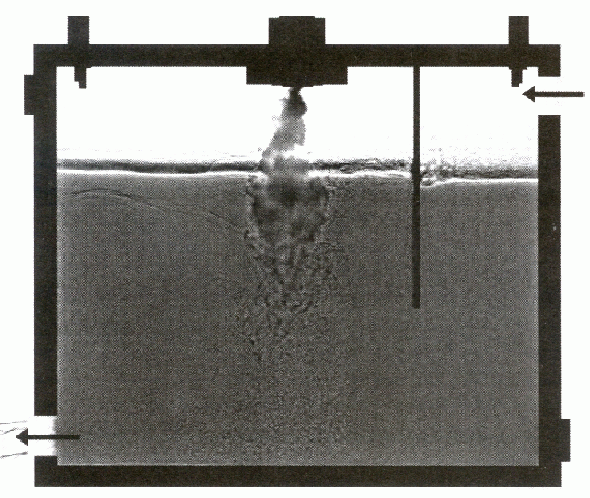
Figure 5. Enhanced shadowgraph image of the flow in a typical salt-bath experiment showing the plume and the two well-mixed layers. The salt water entering from the plume is dyed. The dark vertical line on the right-hand side of the chamber is a screen to reduce mixing from the inflow. Here the inlets and outlets positioned vertically in the walls of the chamber rather than horizontally in the floor and ceiling (as in the CFD simulations and study of Linden et al. (1990)). As noted in the text, however, this difference is not thought to be of significance here. In the salt bath experiments a dense saline plume is used, so the flow is vertically inverted from that shown in Figure 2. (From Hunt & Linden 2001.) Originals of all the figures in this UFR are in UFR4-09_Figures.pdf
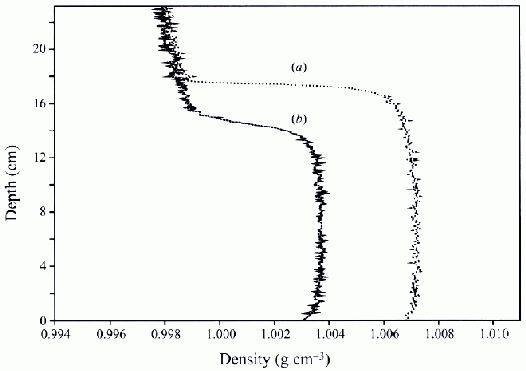
Figure 6. Vertical density profiles in salt bath experiments averaged in the direction normal to the page, obtained by an optical image processing based technique in two salt-bath experiments a) buoyancy driving only (as Figure 5), b) buoyancy and wind driven ventilation (note that this case is not considered here). Note, again, the vertical inversion of the geometry from the standard case. (From Hunt & Linden 2001.) Originals of all the figures in this UFR are in UFR4-09_Figures.pdf
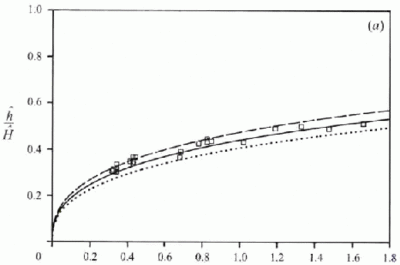
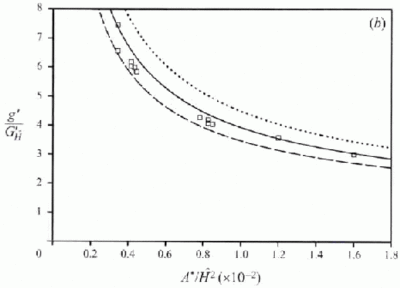
Figure 7. Comparison of salt-bath experiment results with the theoretical model predictions for interface height and reduced gravity (equations 8 & 10). The theoretical curves have been plotted for three values of entrainment constant α = 0.083 (continuous line), α = 0.074 (dashed line) and α = 0.094 (dotted line). In all of the theoretical curves corrections for plume virtual origin offset and opening heights have been made. In the formulae for A* (equation 1) the values of discharge co-efficient used are Ct = 0.6, Cb= 0.5. (From Hunt & Linden 2001.) Originals of all the figures in this UFR are in UFR4-09_Figures.pdf
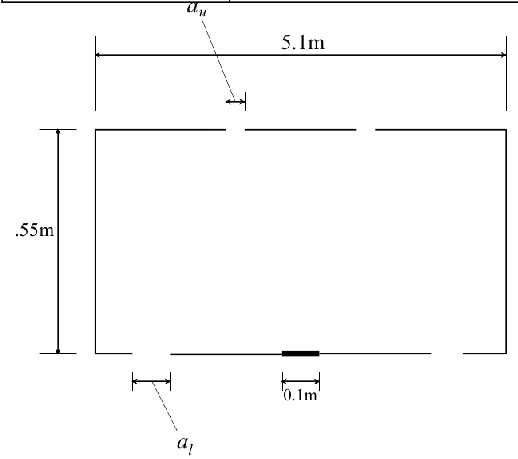
Figure 8. The geometry of the room considered in the CFD simulations. In the 3D simulations the breadth of the room was 1.0m in the direction normal to the page. (Note the difference of notation from that used elsewhere in the paper; here at = au and ab = al). Originals of all the figures in this UFR are in UFR4-09_Figures.pdf
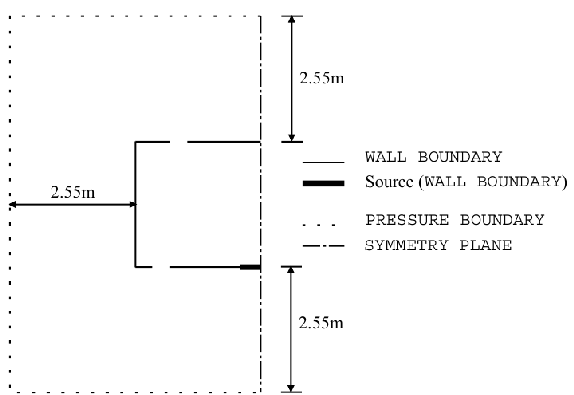
Figure 9. CFD model domain for 2D line-source plumes showing location and type of boundaries (Cook & Lomas 1998). Originals of all the figures in this UFR are in UFR4-09_Figures.pdf
Figure 10. CFD model domain for 3D point-source plumes showing a) location and type of boundaries b) computational mesh (Cook & Lomas 1997). Originals of all the figures in this UFR are in UFR4-09_Figures.pdf
Figure 11. Calculated flow fields (temperature contours and velocity vectors) for 2D line-source plume simulations for (a) plume source heat input, Q = 200 W, effective vent size ![]() =0.148, 'standard' k–ε turbulence model; (b) Q = 1000 W,
=0.148, 'standard' k–ε turbulence model; (b) Q = 1000 W, ![]() =0.148, 'standard' k-ε turbulence model; (c) Q = 200 W,
=0.148, 'standard' k-ε turbulence model; (c) Q = 200 W, ![]() = 0.148, RNG k–ε turbulence model; (d) Q = 1000 W,
= 0.148, RNG k–ε turbulence model; (d) Q = 1000 W, ![]() = 0.148, RNG k–ε turbulence model; (e) Q = 200 W,
= 0.148, RNG k–ε turbulence model; (e) Q = 200 W, ![]() = 0.075, RNG k–ε turbulence model; (f) Q = 200 W,
= 0.075, RNG k–ε turbulence model; (f) Q = 200 W, ![]() =0.227, RNG k–ε turbulence model. Note that only half the room width is shown; the plume and symmetry plane are on the right-hand side of the region shown. (Cook & Lomas 1998)
Originals of all the figures in this UFR are in UFR4-09_Figures.pdf
=0.227, RNG k–ε turbulence model. Note that only half the room width is shown; the plume and symmetry plane are on the right-hand side of the region shown. (Cook & Lomas 1998)
Originals of all the figures in this UFR are in UFR4-09_Figures.pdf
Figure 12. Calculated flow fields (temperature contours and velocity vectors) for 3D point-source plume simulations (Cook & Lomas 1997) for (a) plume source heat input, Q = 200 W, effective vent area ![]() =0.0304, 'standard' k-ε turbulence model; (b) Q = 200 W,
=0.0304, 'standard' k-ε turbulence model; (b) Q = 200 W, ![]() =0.0304, RNG k–ε turbulence model; (c) Q = 200 W,
=0.0304, RNG k–ε turbulence model; (c) Q = 200 W, ![]() RNG k–ε turbulence model, plane normal to room major-axis plane 0.2m from the wall; (d) Q = 1000 W,
RNG k–ε turbulence model, plane normal to room major-axis plane 0.2m from the wall; (d) Q = 1000 W, ![]() =0.0304, RNG k–ε turbulence model. Note that in a), b) and d), only half the room width is shown; the plume and symmetry plane are on the right-hand side of the region shown. (Cook & Lomas 1998)
Originals of all the figures in this UFR are in UFR4-09_Figures.pdf
=0.0304, RNG k–ε turbulence model. Note that in a), b) and d), only half the room width is shown; the plume and symmetry plane are on the right-hand side of the region shown. (Cook & Lomas 1998)
Originals of all the figures in this UFR are in UFR4-09_Figures.pdf
Figure 13. Measurements of a) interface height and b) reduced gravity for 2D line-source plumes, compared with the theoretical model and salt-bath experiments of Linden et al. (1990). In the theoretical curves the value of entrainment coefficient used is α = 0.1 has been used. Note that no-virtual origin corrections have been made and Ct = Cb = 1.0.) Originals of all the figures in this UFR are in UFR4-09_Figures.pdf
Figure 14. Measurements of interface height for 3D point-source plumes, compared with the theoretical model and salt-bath experiments of Linden et al. (1990). Theoretical curves for two different values of entrainment coefficient are shown: the typical value of α = 0.1 and the value inferred from the CFD measurements of α = 0.14. Note that no-virtual origin corrections have been made and Ct = Cb = 1.0. (From Cook 1998). Originals of all the figures in this UFR are in UFR4-09_Figures.pdf
© copyright ERCOFTAC 2004
Contributors: Jake Hacker - Arup