DNS 1-5 Statistical Data: Difference between revisions
| Line 146: | Line 146: | ||
Contour data of averaged velocity components and Reynolds stresses is also provided in [[Lib:DNS_1-5_statistical#figure12|Fig. 12]]. | Contour data of averaged velocity components and Reynolds stresses is also provided in [[Lib:DNS_1-5_statistical#figure12|Fig. 12]]. | ||
Reynolds stresses show an intensity peak which moves away from the wall as the flow moves above the rounded step. | Reynolds stresses show an intensity peak which moves away from the wall as the flow moves above the rounded step. | ||
Downstream the step, however, such peak gets closer to the wall as the boundary layer is | Downstream the step, however, such peak gets closer to the wall as the boundary layer is recovering the canonical behaviour for a zero pressure gradient configuration. | ||
Notice that Reynolds stresses <math>R_{zx}</math> and <math>R_{zy}</math> are one order of magnitude smaller than the other Reynolds stresses. This outcome highlights the uncorrelation of streamwise and normalwise velocity fluctuations with respect to spanwise velocity fluctuations. | Notice that Reynolds stresses <math>R_{zx}</math> and <math>R_{zy}</math> are one order of magnitude smaller than the other Reynolds stresses. This outcome highlights the uncorrelation of streamwise and normalwise velocity fluctuations with respect to spanwise velocity fluctuations. | ||
Revision as of 17:03, 13 February 2023
Statistical data
In this section the relevant statistical data for the flow on the smooth bump computed with MIGALE is given. The reported data is the one mentioned in Table 1 of the list of desirable quantities (PDF).
The data is available as:
- In .vtk (ASCII) format as statistical data (mid-span plane).
- In *vtu (ASCII) format for instantaneous data.
- In CSV (text) format as vertical profiles at various x-positions.
Volume data
Volumetric data on the statistics computed for the whole computational domain are provided here. For more information regarding the stored quantities and the storage format, please refer to the storage format guidelines.
The available files are:
- averaged pressure (20.4 MB).
- averaged velocity x (21.9 MB).
- averaged velocity y (22.8 MB).
- averaged velocity z (23.2 MB).
- Reynolds stress xx (22.8 MB).
- Reynolds stress yx (22.9 MB).
- Reynolds stress yy (22.8 MB).
- Reynolds stress zx (23.3 MB).
- Reynolds stress zy (23.5 MB).
- Reynolds stress zz (22.9 MB).
- Taylor microscale (22.6 MB).
- Kolmogorov length scale (22.6 MB).
- Kolmogorov time scale (22.7 MB).
Profile data
Profile data have been extracted at different streamwise locations () and made dimensionless with respect to reference quantities (, , , see UFR 3-36: Table 2). The data stored in each file are:
- streamwise location
- vertical location
- wall distance
- average pressure
- average velocity components
- Reynolds stress components
- turbulent kinetic energy
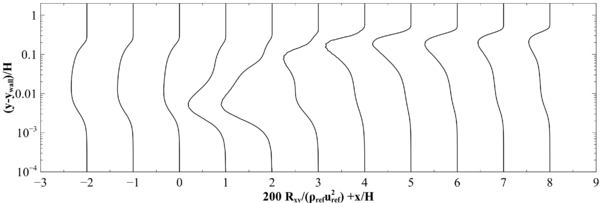
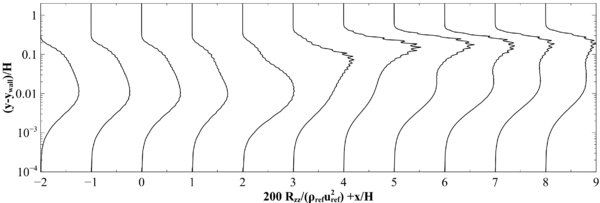
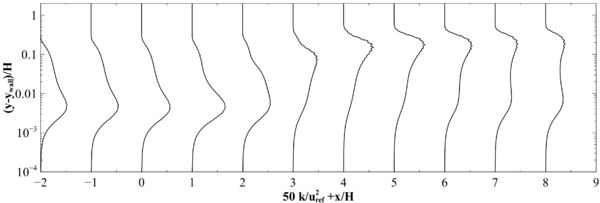
Profiles at selected streamwise locations are reported in Fig. 11.

|

|

|

|

|

|

|

|

|
| Figure 11: HiFi-TURB-DLR rounded step, profiles at selected stremwise locations |
|---|
Contour data
Contour data of averaged velocity components and Reynolds stresses is also provided in Fig. 12. Reynolds stresses show an intensity peak which moves away from the wall as the flow moves above the rounded step. Downstream the step, however, such peak gets closer to the wall as the boundary layer is recovering the canonical behaviour for a zero pressure gradient configuration. Notice that Reynolds stresses and are one order of magnitude smaller than the other Reynolds stresses. This outcome highlights the uncorrelation of streamwise and normalwise velocity fluctuations with respect to spanwise velocity fluctuations.

|

|

|

|

|

|

|

|
| Figure 12: HiFi-TURB-DLR rounded step, contours of averaged velocity components and Reynolds stresses |
|---|
Additional data
The following averaged quantities are provided along the solid wall:
- the pressure coefficient
- the skin friction coefficient
The pressure coefficient is defined as , where is the pressure at wall at the checkpoint , while the skin friction coefficient is defined as . and are the velocity and density at the reference conditions (see UFR 3-36: Table 2), respectively. Both coefficients have been obtained by averaging along the span direction the time averaged solution.
| wall_dns.csv |
 |

|
| Figure 13: HiFi-TURB-DLR rounded step, pressure and skin friction coefficients on the solid wall | |
|---|---|
Contributed by: Francesco Bassi, Alessandro Colombo, Francesco Carlo Massa — Università degli studi di Bergamo (UniBG)
© copyright ERCOFTAC 2024


