UFR 4-09 Test Case: Difference between revisions
m (Dave.Ellacott moved page Gold:UFR 4-09 Test Case to UFR 4-09 Test Case over redirect) |
|||
| (66 intermediate revisions by the same user not shown) | |||
| Line 27: | Line 27: | ||
where ''a''<sub>t</sub> and ''a''<sub>b</sub> are the areas of the outlet (‘top’) and inlet (‘bottom’) openings, ''C''<sub>t</sub> and ''C''<sub>b</sub> are discharge coefficients for the outlet and inlet defined by: | where ''a''<sub>t</sub> and ''a''<sub>b</sub> are the areas of the outlet (‘top’) and inlet (‘bottom’) openings, ''C''<sub>t</sub> and ''C''<sub>b</sub> are discharge coefficients for the outlet and inlet defined by: | ||
{{DisplayEquation|eqn=Q_{t,b}=C_{t,b}\left(2\Delta p_{t,b}/\rho\right)^{1/2} }} | |||
<!--[[Image:U4-09d32_files_image004.gif]]-->where <!--[[Image:U4-09d32_files_image006.gif]]--> <math>\left.\Delta p\right.</math> is the magnitude of the pressure difference across the opening between internal and external (atmospheric) pressure. | |||
The work of Linden ''et al.'' (1990) has shown that, subject to certain provisos discussed below, the height of the interface is independent of the buoyancy source strength and is dependent only on ''A''<nowiki>*. The provisos on this result relate to the values of a number of important non-dimensional parameters, as discussed below.</nowiki> | The work of Linden ''et al.'' (1990) has shown that, subject to certain provisos discussed below, the height of the interface is independent of the buoyancy source strength and is dependent only on ''A''<nowiki>*. The provisos on this result relate to the values of a number of important non-dimensional parameters, as discussed below.</nowiki> | ||
| Line 53: | Line 55: | ||
{{DisplayEquation|no=2|eqn=\lambda = \frac{a_t}{a_b} }} | |||
\lambda = \frac{a_t}{a_b} | |||
| Line 68: | Line 68: | ||
The density within the plume is usually expressed by the reduced gravity: | The density within the plume is usually expressed by the reduced gravity: | ||
[[Image:U4-09d32_files_image014.gif]] | {{DisplayEquation|eqn=g'=g\frac{\rho'}{\rho_0} }} | ||
<!--[[Image:U4-09d32_files_image014.gif]]--> | |||
where ''g'' is the acceleration due to gravity, [[Image:U4-09d32_files_image016.gif]] is the density difference relative to the ambient density [[Image:U4-09d32_files_image018.gif]] | where ''g'' is the acceleration due to gravity, ''ρ′ = ρ − ρ<sub>0</sub>'' <!--[[Image:U4-09d32_files_image016.gif]]-->is the density difference relative to the ambient density ''ρ<sub>0</sub>''. <!--[[Image:U4-09d32_files_image018.gif]]--> | ||
The central parameter in the plume dynamics is the buoyancy flux, ''B'', which is the flux of ''g ′'' at the plume source. For a representative volume element ''δV'', the buoyancy flux is defined by: | The central parameter in the plume dynamics is the buoyancy flux, ''B'', which is the flux of ''g ′'' at the plume source. For a representative volume element ''δV'', the buoyancy flux is defined by: | ||
{{DisplayEquation|no=3|eqn=B = g\frac{\partial}{\partial t}\left(\frac{\Delta\rho_s}{\rho_0}\right)\delta V }} | |||
B = g\frac{\partial}{\partial t}\left(\frac{\Delta\rho_s}{\rho_0}\right)\delta V | |||
where [[Image:U4-09d32_files_image022.gif]] is the density difference effected at the plume source, it being understood that the rate of change here is that which would occur in the absence of any other buoyancy flux into''δV'', rather than that realised in practice. The SI units of ''Β'' are m<sup>4</sup>s<sup>-3</sup>. | where ''Δρ<sub>s</sub>'' <!--[[Image:U4-09d32_files_image022.gif]]--> is the density difference effected at the plume source, it being understood that the rate of change here is that which would occur in the absence of any other buoyancy flux into ''δV'', rather than that realised in practice. The SI units of ''Β'' are m<sup>4</sup>s<sup>-3</sup>. | ||
For a thermal plume, [[Image:U4-09d32_files_image024.gif]], where ''β ''is the co-efficient of thermal expansion and [[Image:U4-09d32_files_image026.gif]] is the temperature difference between the plume source and the ambient surroundings. The heat flux, ''Q'', at the plume source is defined, in analogy with (3), by: | For a thermal plume, ''ρ<sub>s</sub> = ρ<sub>0</sub> βΔT<sub>s</sub>'' <!--[[Image:U4-09d32_files_image024.gif]]-->, where ''β ''is the co-efficient of thermal expansion and ''ΔT<sub>s</sub>'' <!--[[Image:U4-09d32_files_image026.gif]]--> is the temperature difference between the plume source and the ambient surroundings. The heat flux, ''Q'', at the plume source is defined, in analogy with (3), by: | ||
[[Image:U4-09d32_files_image028.gif]] | {{DisplayEquation|eqn=Q=\frac{\partial}{\partial t}\left(\rho_0 c_p \Delta T_s\right)\delta V=\frac{\rho_0 c_p}{\beta} | ||
\frac{\partial}{\partial t}\left(\frac{\Delta\rho_s}{\rho_0}\right)\delta V }} | |||
<!--[[Image:U4-09d32_files_image028.gif]]--> | |||
Substituting the above equation in (3), the thermal buoyancy flux is found to be: | Substituting the above equation in (3), the thermal buoyancy flux is found to be: | ||
{{DisplayEquation|no=3a|eqn=B_T = \frac{g\beta Q}{\rho_0 c_p} }} | |||
B_T = \frac{g\beta Q}{\rho_0 c_p} | |||
For the saline plumes in the salt bath experiments, the buoyancy flux is an advective one, associated with saline water being supplied at density [[Image:U4-09d32_files_image032.gif]] and volumetric flow rate ''q''. Hence: | For the saline plumes in the salt bath experiments, the buoyancy flux is an advective one, associated with saline water being supplied at density ''ρ = ρ<sub>0</sub> + Δρ'' <!--[[Image:U4-09d32_files_image032.gif]]--> and volumetric flow rate ''q''. Hence: | ||
{{DisplayEquation|no=3b|eqn=B_S = g\frac{\Delta\rho_s}{\rho_0}q }} | |||
B_S = g\frac{\Delta\rho_s}{\rho_0}q | |||
| Line 105: | Line 102: | ||
{{DisplayEquation|no=4|eqn=\Gamma = \frac{Q_0^2 B}{M_0^\frac{5}{2} } }} | |||
\Gamma = \frac{Q_0^2 B}{M_0^\frac{5}{2}} | |||
where ''Q''<sub>0</sub> and ''M''<sub>0</sub> are volume and momentum fluxes at the plume source, respectively. When | where ''Q''<sub>0</sub> and ''M''<sub>0</sub> are volume and momentum fluxes at the plume source, respectively. | ||
When ''Γ'' < 1, the plume has an excess of momentum over buoyancy and is described as ‘forced’. When ''Γ'' > 1, the plume has a defecit of momentum over buoyancy and is described as ‘lazy’. | |||
Turbulent plumes generally adjust to a self-similar state some distance from their source and thereafter have width increasing at a constant rate with height. Classical plume theory uses this observation to relate the rate of entrainment to the average velocity in the plume through the entrainment constant ''α'' ≈ 0.1 (Morton, Taylor & Turner 1958). In order to account for the initial adjustment region, theoretical plume models utilise a ‘virtual origin correction’ which is dependent on the value of ''Γ''(Hunt & Kaye 2001). | Turbulent plumes generally adjust to a self-similar state some distance from their source and thereafter have width increasing at a constant rate with height. Classical plume theory uses this observation to relate the rate of entrainment to the average velocity in the plume through the entrainment constant ''α'' ≈ 0.1 (Morton, Taylor & Turner 1958). In order to account for the initial adjustment region, theoretical plume models utilise a ‘virtual origin correction’ which is dependent on the value of ''Γ''(Hunt & Kaye 2001). | ||
Within the formula for ''A''*, the discharge coefficients ''C''<sub>t</sub> and ''C''<sub>b</sub> are of importance because they determine the rate of flow through the space for given driving pressure (or buoyancy head). It is therefore important to use appropriate values when comparing results. In the salt bath experiments reported by Linden ''et al.'' (1991) values taken were ''C''<sub>t </sub>= ''C''<sub>b</sub> = 1.0 which are somewhat higher than would be expected for the sharp-edged type orifices used in the experiments. More recent work by Hunt & Linden (1999, 2001) has shown that better agreement with theory can be obtained if the more classical values of ''C''<sub>t</sub> = 0.6 and ''C''<sub>b</sub> = 0.5 are used. An additional note of caution is that under some circumstances the value of ''C''<sub>t </sub>has been found to be affected by buoyancy and also opening orientation (e.g. ceiling or wall) with dependence on the value of the source coefficient ''Γ''<sub>t</sub> for the top opening (Hunt & Holford 1999, Holford & Hunt 2001). | Within the formula for ''A''*, the discharge coefficients ''C''<sub>t</sub> and ''C''<sub>b</sub> are of importance because they determine the rate of flow through the space for given driving pressure (or buoyancy head). It is therefore important to use appropriate values when comparing results. In the salt bath experiments reported by Linden ''et al.'' (1991) values taken were ''C''<sub>t </sub>= ''C''<sub>b</sub> = 1.0 which are somewhat higher than would be expected for the sharp-edged type orifices used in the experiments. More recent work by Hunt & Linden (1999, 2001) has shown that better agreement with theory can be obtained if the more classical values of ''C''<sub>t</sub> = 0.6 and ''C''<sub>b</sub> = 0.5 are used. An additional note of caution is that under some circumstances the value of ''C''<sub>t </sub>has been found to be affected by buoyancy and also opening orientation (e.g. ceiling or wall) with dependence on the value of the source coefficient ''Γ''<sub>t</sub> for the top opening (Hunt & Holford 1999, Holford & Hunt 2001). | ||
''Dependent variables'' | ''Dependent variables'' | ||
| Line 120: | Line 117: | ||
Important dependent variables are: | Important dependent variables are: | ||
[[Image:U4-09d32_files_image038.gif]], the fractional height of the interface, where ''h'' is the dimensional interface height | :<math>\xi=\frac{h}{H}</math>, <!--[[Image:U4-09d32_files_image038.gif]],--> the fractional height of the interface, where ''h'' is the dimensional interface height | ||
:<math>\frac{\Delta T}{T_0}</math>, <!--[[Image:U4-09d32_files_image040.gif]],--> the relative temperature difference between the lower and upper layer, where ''ΔT'' is the temperature difference between the layers, and ''T''<sub>0</sub> is the temperature of the lower layer and ambient surroundings. | |||
The temperature difference ''ΔT'' enters the dynamics through the reduced gravity ''g ′'', defined by: | |||
:<math>g'=g\frac{\Delta T}{T_0}</math> <!--[[Image:U4-09d32_files_image046.gif]]--> is the acceleration due to gravity. | |||
This parameter relates to the buoyancy of the upper layer and is often quoted in place of ''ΔT''. | |||
''Theoretical formulae for dependent variables'' | ''Theoretical formulae for dependent variables'' | ||
The theory of Linden ''et al''. (1990) give the following formulae for the dependent variables for single plumes in rectangular enclosures when: walls are adiabatic, radiative effects are ignored, the walls are sufficiently far from the plume source not to affect the dynamics of the plume, and it is implicitly assumed that the displacement flow is able to develop (ie. there is no mechanism present to cause breakdown of the density interface). | The theory of Linden ''et al''. (1990) give the following formulae for the dependent variables for single plumes in rectangular enclosures when: walls are adiabatic, radiative effects are ignored, the walls are sufficiently far from the plume source not to affect the dynamics of the plume, and it is implicitly assumed that the displacement flow is able to develop (ie. there is no mechanism present to cause breakdown of the density interface). | ||
<u>2D Line-source plume (extending across whole width of room):</u> | <u>2D Line-source plume (extending across whole width of room):</u> | ||
| Line 139: | Line 141: | ||
{{DisplayEquation|no=5|eqn=\frac{A_L^{*} }{H} = D^\frac{3}{2}{\left(\frac{\zeta^3}{1-\zeta}\right)}^\frac{1}{2} }} | |||
\frac{A_L^{*}}{H} = D^\frac{3}{2}{\left(\frac{\zeta^3}{1-\zeta}\right)}^\frac{1}{2} | |||
{{DisplayEquation|no=6|eqn=\Delta\widehat{T} = \frac{B_L^\frac{2}{3} }{gDH}\zeta^{-1} }} | |||
where [[Image:U4-09d32_files_image053.gif]], in which | where <math>\left.D=(2\alpha)^{2/3}\right.</math> <!--[[Image:U4-09d32_files_image053.gif]]-->, in which <math>\left.\alpha\right.</math> is the entrainment constant of the plume and <math>A_L^{*}=A^{*}/b</math> <!--[[Image:U4-09d32_files_image055.gif]]-->, <math>\left.B_L=B/L\right.</math> where ''L'' is the width of the room. From equation (6), a nondimensional stratification strength, independent of ''B'', may be defined: | ||
{{DisplayEquation|no=7a|eqn=\hat{g}^\prime = \frac{g^\prime}{G_H^\prime} = \zeta^{-1} }} | |||
\hat{g}^\prime = \frac{g^\prime}{G_H^\prime} = \zeta^{-1} | |||
| Line 160: | Line 155: | ||
{{DisplayEquation|no=7b|eqn=G_H^\prime = \frac{B_L^\frac{2}{3} }{DH}\zeta^{-1} }} | |||
G_H^\prime = \frac{B_L^\frac{2}{3}}{DH}\zeta^{-1} | |||
| Line 177: | Line 170: | ||
{{DisplayEquation|no=8|eqn=\frac{A^{*} }{H^2} = C^\frac{3}{2}{\left(\frac{\zeta^5}{1-\zeta}\right)}^\frac{1}{2} }} | |||
\frac{A^{*}}{H^2} = C^\frac{3}{2}{\left(\frac{\zeta^5}{1-\zeta}\right)}^\frac{1}{2} | |||
{{DisplayEquation|no=9|eqn=\Delta\widehat{T}=\frac{{\left(B^2H^{-5}\right)}^\frac{1}{3} }{gC}\zeta^{-\frac{5}{3}} }} | |||
\Delta\widehat{T} = \frac{{\left(B^2H^{-5}\right)}^\frac{1}{3}}{gC}\zeta^{-\frac{5}{3}} | |||
where [[Image:U4-09d32_files_image065.gif]] | where | ||
<math>C=6\alpha\left(9\alpha/10\right)^{1/3}\pi^{2/3}/5</math>. <!--[[Image:U4-09d32_files_image065.gif]]--> Alternatively, equation (9) may be written: | |||
{{DisplayEquation|no=10a|eqn=\hat{g}^\prime = \frac{g^\prime}{G_H^\prime} = \zeta^{-\frac{5}{3} } }} | |||
\hat{g}^\prime = \frac{g^\prime}{G_H^\prime} = \zeta^{-\frac{5}{3}} | |||
| Line 200: | Line 186: | ||
{{DisplayEquation|no=10b|eqn=G_H^\prime = \frac{{\left(B^2H^{-5}\right)}^\frac{1}{3}}{C} }} | |||
G_H^\prime = \frac{{\left(B^2H^{-5}\right)}^\frac{1}{3}}{C} | |||
is, again, the value of ''g ′'' that would be attained in an equivalent free plume at the ceiling height. Equations (8) and (10) are plotted in Figure 4. | is, again, the value of ''g ′'' that would be attained in an equivalent free plume at the ceiling height. Equations (8) and (10) are plotted in Figure 4. | ||
'''Note''': in all the above formulae a correction needs be applied to [[Image:U4-09d32_files_image071.gif]] to allow for the virtual origin of the plume (Hunt & Kaye, 2001; Hunt & Linden 2001). A modification is also required if the openings are on the sides of the enclosure rather than on the floor and ceiling (Hunt & Linden 2001). There may also be uncertainty regarding the exact value of the entrainment constant ''α''. | '''Note''': in all the above formulae a correction needs be applied to ''ζ'' <!--[[Image:U4-09d32_files_image071.gif]]--> to allow for the virtual origin of the plume (Hunt & Kaye, 2001; Hunt & Linden 2001). A modification is also required if the openings are on the sides of the enclosure rather than on the floor and ceiling (Hunt & Linden 2001). There may also be uncertainty regarding the exact value of the entrainment constant ''α''. | ||
<center>[[Image:UFR4-09_Fig4a.gif|400px]] [[Image:UFR4-09_Fig4b.gif|400px]]</center> | <center>[[Image:UFR4-09_Fig4a.gif|400px]] [[Image:UFR4-09_Fig4b.gif|400px]]</center> | ||
Latest revision as of 14:20, 12 February 2017
Confined buoyant plume
Underlying Flow Regime 4-09 © copyright ERCOFTAC 2004
Test Case
Brief description of the study test case
In this section the governing parameters are identified.
Governing parameters
A principal governing parameter is the effective area, A*, defined by:
where at and ab are the areas of the outlet (‘top’) and inlet (‘bottom’) openings, Ct and Cb are discharge coefficients for the outlet and inlet defined by:
where is the magnitude of the pressure difference across the opening between internal and external (atmospheric) pressure.
The work of Linden et al. (1990) has shown that, subject to certain provisos discussed below, the height of the interface is independent of the buoyancy source strength and is dependent only on A*. The provisos on this result relate to the values of a number of important non-dimensional parameters, as discussed below.
The Peclet and Reynolds numbers for the largest eddy scales are (Linden 1999):
where U is a typical velocity, H is the height of the space, κ is the diffusivity of the density-affecting scalar (e.g. temperature or salinity) and ν the kinematic viscosity of the fluid.
These parameters indicate the relative importance of turbulent mixing at the largest eddy scale over the diffusion of buoyancy and momentum respectively. In general, if Pe and Re are sufficiently large, flow dynamics should be insensitive to the values of these parameters. The advantages of using saline water rather than heated air for small-scale laboratory studies is that:
(i) the molecular diffusivity of NaCl in water is two orders of magnitude smaller than that of heat, therefore making Pe two orders of magnitude larger for given U and H;
(ii) the kinematic viscosity of water is an order of magnitude smaller than that of air, therefore making Re an order of magnitude larger for given U and H ;
(iii) larger density differences, and hence larger U for given scale, are more easily generated using salt than heat, thereby enabling larger Re and Pe for given H.
Taken together, these factors mean that it is possible to keep both Pe and Re at higher values in the laboratory using salt in water than heat in water or heat in air. For example, in the salt-bath models of Linden et al. (1990), values of Re and Pe exceeded 10³, which is comparable to values in full-scale building air flows.
The ratio of the upper to the lower openings, λ, defined by:
also appears to have importance in influencing the character of the flow (Lane-Serff, 1989; Cook 1998; G. R. Hunt 2003, personal communication). If the value of this parameter is large, then:
(i) the inlet opening area is small and the inlet jet has relatively high momentum;
(ii) the upper opening is relatively large, which can result in a two-way exchange flow developing at the upper opening.
Both effects potentially lead to vertical mixing across the interface and breakdown of the two-layer stratification.
The density within the plume is usually expressed by the reduced gravity:
where g is the acceleration due to gravity, ρ′ = ρ − ρ0 is the density difference relative to the ambient density ρ0.
The central parameter in the plume dynamics is the buoyancy flux, B, which is the flux of g ′ at the plume source. For a representative volume element δV, the buoyancy flux is defined by:
where Δρs is the density difference effected at the plume source, it being understood that the rate of change here is that which would occur in the absence of any other buoyancy flux into δV, rather than that realised in practice. The SI units of Β are m4s-3.
For a thermal plume, ρs = ρ0 βΔTs , where β is the co-efficient of thermal expansion and ΔTs is the temperature difference between the plume source and the ambient surroundings. The heat flux, Q, at the plume source is defined, in analogy with (3), by:
Substituting the above equation in (3), the thermal buoyancy flux is found to be:
For the saline plumes in the salt bath experiments, the buoyancy flux is an advective one, associated with saline water being supplied at density ρ = ρ0 + Δρ and volumetric flow rate q. Hence:
An important non-dimensional parameter involving the buoyancy flux is the plume source parameter, defined for an axisymmetric plume by:
where Q0 and M0 are volume and momentum fluxes at the plume source, respectively.
When Γ < 1, the plume has an excess of momentum over buoyancy and is described as ‘forced’. When Γ > 1, the plume has a defecit of momentum over buoyancy and is described as ‘lazy’.
Turbulent plumes generally adjust to a self-similar state some distance from their source and thereafter have width increasing at a constant rate with height. Classical plume theory uses this observation to relate the rate of entrainment to the average velocity in the plume through the entrainment constant α ≈ 0.1 (Morton, Taylor & Turner 1958). In order to account for the initial adjustment region, theoretical plume models utilise a ‘virtual origin correction’ which is dependent on the value of Γ(Hunt & Kaye 2001).
Within the formula for A*, the discharge coefficients Ct and Cb are of importance because they determine the rate of flow through the space for given driving pressure (or buoyancy head). It is therefore important to use appropriate values when comparing results. In the salt bath experiments reported by Linden et al. (1991) values taken were Ct = Cb = 1.0 which are somewhat higher than would be expected for the sharp-edged type orifices used in the experiments. More recent work by Hunt & Linden (1999, 2001) has shown that better agreement with theory can be obtained if the more classical values of Ct = 0.6 and Cb = 0.5 are used. An additional note of caution is that under some circumstances the value of Ct has been found to be affected by buoyancy and also opening orientation (e.g. ceiling or wall) with dependence on the value of the source coefficient Γt for the top opening (Hunt & Holford 1999, Holford & Hunt 2001).
Dependent variables
Important dependent variables are:
- , the fractional height of the interface, where h is the dimensional interface height
- , the relative temperature difference between the lower and upper layer, where ΔT is the temperature difference between the layers, and T0 is the temperature of the lower layer and ambient surroundings.
The temperature difference ΔT enters the dynamics through the reduced gravity g ′, defined by:
- is the acceleration due to gravity.
This parameter relates to the buoyancy of the upper layer and is often quoted in place of ΔT.
Theoretical formulae for dependent variables
The theory of Linden et al. (1990) give the following formulae for the dependent variables for single plumes in rectangular enclosures when: walls are adiabatic, radiative effects are ignored, the walls are sufficiently far from the plume source not to affect the dynamics of the plume, and it is implicitly assumed that the displacement flow is able to develop (ie. there is no mechanism present to cause breakdown of the density interface).
2D Line-source plume (extending across whole width of room):
For line-source plumes the model gives:
where , in which is the entrainment constant of the plume and , where L is the width of the room. From equation (6), a nondimensional stratification strength, independent of B, may be defined:
where
is the value of g ′ that would be attained in an equivalent free plume at the ceiling height. Equations (5) and (7) are plotted in Figure 3.
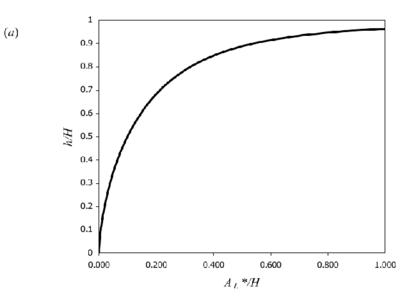
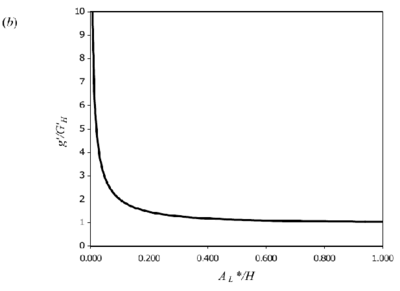
Figure 3. Theoretical curves for 2D line-source plumes for a) interface height and (b) reduced gravity (equations 5 & 7). Originals of all the figures in this UFR are in UFR4-09_Figures.pdf
3D axisymmetric point-source plumes:
For axisymmetric point-source plumes the model gives:
where
. Alternatively, equation (9) may be written:
where
is, again, the value of g ′ that would be attained in an equivalent free plume at the ceiling height. Equations (8) and (10) are plotted in Figure 4.
Note: in all the above formulae a correction needs be applied to ζ to allow for the virtual origin of the plume (Hunt & Kaye, 2001; Hunt & Linden 2001). A modification is also required if the openings are on the sides of the enclosure rather than on the floor and ceiling (Hunt & Linden 2001). There may also be uncertainty regarding the exact value of the entrainment constant α.
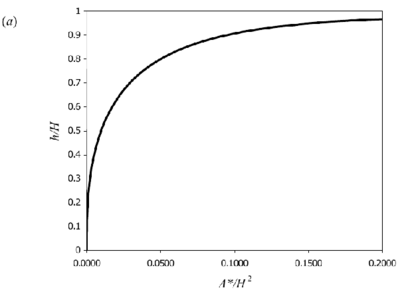
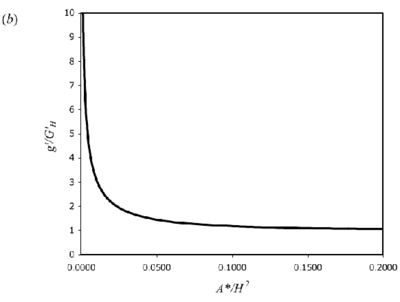
Figure 4. Theoretical curves for 3D point-source plumes for a) interface height and (b) reduced gravity (equations 8 & 10). Originals of all the figures in this UFR are in UFR4-09_Figures.pdf
Test Case Experiments
The salt-bath experiments forming the basis for the test case were carried out in rectangular Perspex tanks with dense saline plumes descending into fresh water. Since non-dimensional results are to be compared, the exact details of the experiments are not of direct importance but are noted below for completeness. Note that because the flow is assumed to be Boussinesq, the fact that dense rather than buoyant plumes were used is not of significance.
In all experiments the saline plumes were created by supplying saline water of fixed density through a plume nozel at constant flow rate. In the experiments reported here the saline water was supplied using a gravity feed system from a header tank.
The experimental results that are to be compared with the CFD calculations in §6 are from the study of Linden et al (1990). In this work, the openings to the enclosure were horizontal, in the floor and ceiling. However, the more recent study of Hunt & Linden (2001) will also be discussed as this contains additional findings that are of relevance. In this second study the openings were vertically aligned, in the walls of the enclosure. Note however, within the context of the generic flow considered here, the nature of the orientation and geometry of the openings is only important in so far as these factors influence the openings discharge coefficients (and providing each set of openings are wholly submerged in the respective layers). In the parameter range considered, the discharge coefficients of the vertical and horizontal openings are unlikely to be significant, although as noted in §3, under certain conditions, buoyancy effects can influence the discharge coefficient of the ‘upper’ openings (outlets).
In all experiments the principal quantities measured were the height of the interface and the density of the upper layer. In Linden et al (1990) these measurements were made, respectively, using a ruler and by withdrawing samples and measuring salinity using a refractometer. In Hunt & Linden (2001) these measurements were made by analysis of digitized video images, density being measured using an optical technique that is discussed below.
Linden et al. (1990)
Considers both point and line-source plumes.
Tank dimensions:
Tank dimensions: 0.25 m (H)×0.20 m (W)×0.30 m (L), situated in a reservoir of fresh water 0.6 m (H)×0.6 m (W)×13 m (L).
Openings:
Point-sources: A* / H2 = 0.005 to 0.055
The openings consisted of a number of holes: Ø 1.8 to 5.5 cm aligned horizontally in the floor and ceiling of box. These could be opened or closed using plastic bungs.
Plume characteristics:
Line-sources: perspex tube extending across the width of the tank (20cm) with small regularly spaced holes in one side
Point-sources: small downward tube covered in foam rubber
Typical parameters: volume flux = 20 cm3/s; buoyancy flux, B=1000 cm4 /s3. Exact values of plume source parameter, Γ, were not reported, but are expected to have been quite high (forced plumes).
Measurements:
Measurements of density were made by withdrawing fluid using a syringe and using an optical refractometer to measure salt concentration. In some cases a conductivity probe was also used to measure salt concentration. Measurements of interface height were made using a ruler. The accuracy of these measurements was not reported but was probably within 5% for density and ±1mm for interface height h. Note, however, that since the interface is not perfectly sharp there will be an additional (unknown) error associated with the subjectivity of the measurement of h.
Hunt & Linden (2001)
This more recent study has not be used for direct comparison with the CFD simulations but is included here for completeness as it contains useful additional information. The main purpose of the study was to investigate wind-assisted stack ventilation, but experiments with no wind were also carried out. Only point-source plumes were considered. For these, a different design of plume nozzle was used which gave better source conditions. The inlets and outlets were in the sides of the box.
Tank dimensions:
Tank dimensions: 0.25 m (H)×0.15 m (W)×0.295 m (L), situated in a reservoir of fresh water 0.57 m (H)×0.30 m (W)×2.65 m (L).
Openings:
A* / H² = 0.003 to 0.017.
Vents consisted of a number of holes: Ø 2.0 aligned vertically in the sidesof the enclosure. As before, these could be opened or closed using plastic bungs.
Plume characteristics:
Point-sources: ‘Cooper’ expansion nozzle giving turbulent flow at source. Ø 0.5 cm.
Exact values of plume source parameter, Γ , were not reported, but are expected to have been significantly lower that in Linden et al. (1990) (ie. closer to being lazy plumes).
Results
A typical displacement flow observed in the salt-bath experiments is shown in figure 5. Note that since dense saline plumes were used, the situation is inverted vertically over that which has been considered so far. The fluid in the plume has been dyed and the visualisation shows that nearly all this fluid ends up in the ‘upper’ (here lower) layer. Both layers are nearly fully mixed. These observations have been made more quantitative (Hunt & Linden 2001) by using image processing to measure dye concentration, which provides a proxy for salt concentration. These measurements give 2D width-averaged density fields (averaged in the direction of viewing). Example profiles are shown in Figure 6. The 2D fields (not included here) confirm that the layers are more or less well-mixed away from the plume boundaries , although with some weak stratification in each layer.
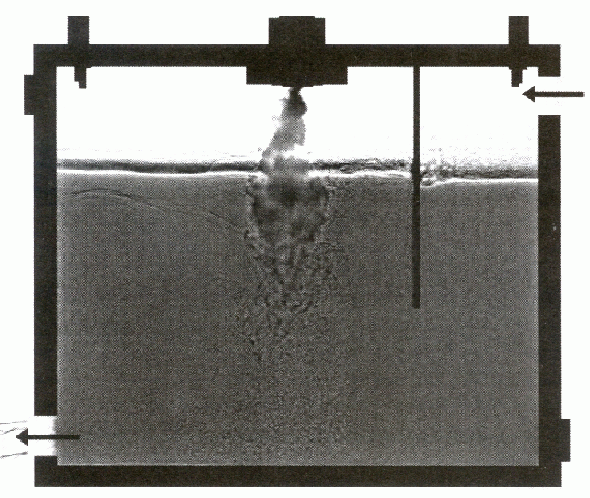
Figure 5. Enhanced shadowgraph image of the flow in a typical salt-bath experiment showing the plume and the two well-mixed layers. The salt water entering from the plume is dyed. The dark vertical line on the right-hand side of the chamber is a screen to reduce mixing from the inflow. Here the inlets and outlets positioned vertically in the walls of the chamber rather than horizontally in the floor and ceiling (as in the CFD simulations and study of Linden et al. (1990)). As noted in the text, however, this difference is not thought to be of significance here. In the salt bath experiments a dense saline plume is used, so the flow is vertically inverted from that shown in Figure 2. (From Hunt & Linden 2001.) Originals of all the figures in this UFR are in UFR4-09_Figures.pdf
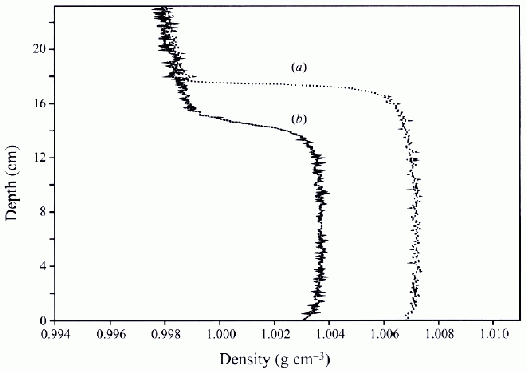
Figure 6. Vertical density profiles in salt bath experiments averaged in the direction normal to the page, obtained by an optical image processing based technique in two salt-bath experiments a) buoyancy driving only (as Figure 5), b) buoyancy and wind driven ventilation (note that this case is not considered here). Note, again, the vertical inversion of the geometry from the standard case. (From Hunt & Linden 2001.) Originals of all the figures in this UFR are in UFR4-09_Figures.pdf
Measurements of interface height h and reduced gravity g ′ from Linden et al. (1990) are shown in Figures 13-14 (along with the CFD results to be discussed in Section 6). Similar measurements from Hunt & Linden (2001) are shown in Figure 7 together with theoretical curves. In the theoretical curves, corrections have been made for plume virtual origin and opening height. Curves for three values of entrainment constant are shown for comparison.
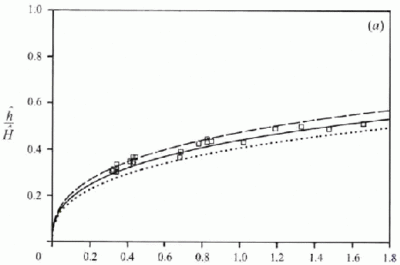
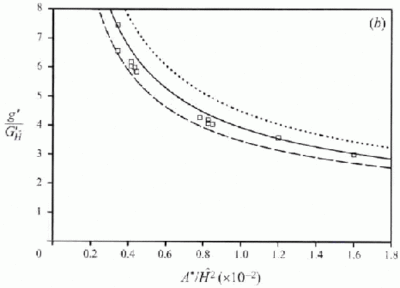
Figure 7. Comparison of salt-bath experiment results with the theoretical model predictions for interface height and reduced gravity (equations 8 & 10). The theoretical curves have been plotted for three values of entrainment constant α = 0.083 (continuous line), α = 0.074 (dashed line) and α = 0.094 (dotted line). In all of the theoretical curves corrections for plume virtual origin offset and opening heights have been made. In the formulae for A* (equation 1) the values of discharge co-efficient used are Ct = 0.6, Cb= 0.5. (From Hunt & Linden 2001.) Originals of all the figures in this UFR are in UFR4-09_Figures.pdf
CFD Methods
Cook & Lomas (1997, 1998) modelled a full-size room air flow in an analogous geometry to the salt-bath experiments and compared non-dimensionalised results with the experimental and theoretical results of Linden et al. (1990). The salt bath experiments were not modelled directly as the aim was to apply the work to full-size air flows in buildings, rather than carry out detailed validation of the CFD technique against the salt-bath data. Both 2D line-source plumes (Cook & Lomas 1998) and 3D point-source plumes (Cook & Lomas 1997) were considered. Details of the computational procedure are similar in the two cases and the details are summarised below. Further details of can be found in the two source papers and in Cook (1998).
Domain size
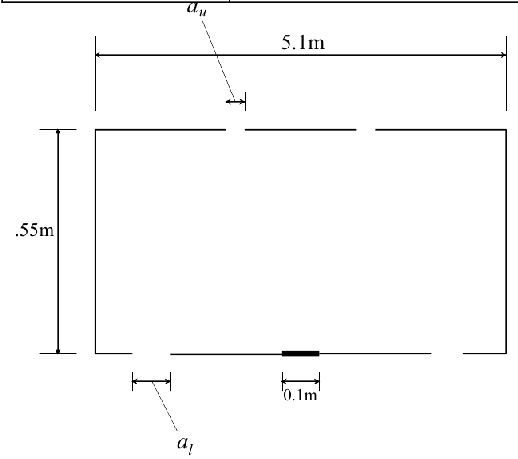
Figure 8. The geometry of the room considered in the CFD simulations. In the 3D simulations the breadth of the room was 1.0m in the direction normal to the page. (Note the difference of notation from that used elsewhere in the paper; here at = au and ab = al). Originals of all the figures in this UFR are in UFR4-09_Figures.pdf
The room modelled in both line- and point- source simulations had dimensions 2.55 m (H) × 5.1 m (L) × 1.0 m (W) (Figure 8). The plume was positioned at the centre of the room. There were two outlets on the ceiling and two inlets on the floor, slightly offset from the outlets above. The pairs of inlets were centred on the major axis (longer horizontal dimension) of the room and positioned symmetrically about the minor axis (smaller horizontal dimension). This line was taken to be a symmetry plane so that only one half of the room needed to be modelled, giving a space 2.55(H)×2.55(L)×1.0(W) m3. In order to avoid the need to specify discharge coefficients for the inlets and outlets, a volume of exterior space was modelled surrounding the room. For the 2D line-source simulations the exterior space extended for 2.55m from all surfaces in the plane of the major axis of the room (Figure 9). For the 3D point-source simulations, the exterior space extended for 2.55m above and below the room only (Figure 10). The solid boundaries of the room were modelled as zero-thickness surfaces.
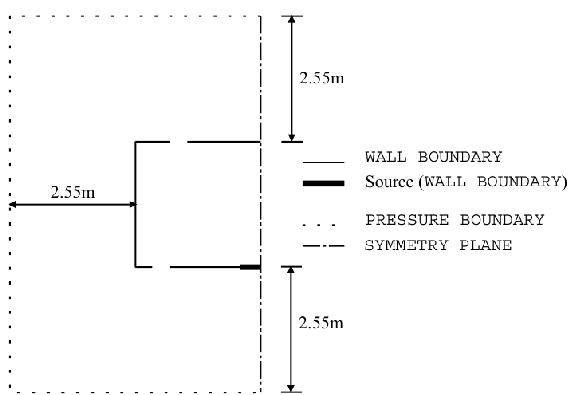
Figure 9. CFD model domain for 2D line-source plumes showing location and type of boundaries (Cook & Lomas 1998). Originals of all the figures in this UFR are in UFR4-09_Figures.pdf
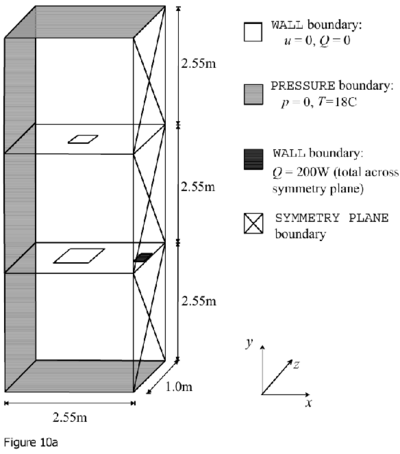
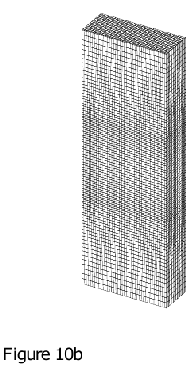
Figure 10. CFD model domain for 3D point-source plumes showing a) location and type of boundaries b) computational mesh (Cook & Lomas 1997). Originals of all the figures in this UFR are in UFR4-09_Figures.pdf
Fluid properties
The working fluid was air and the flow was taken to be incompressible
Boundary conditions
Dynamic: In addition to a central symmetry plane, the dynamic boundary conditions were no-slip boundaries with standard wall functions at the solid boundaries of the room and pressure boundaries (at uniform pressure) at the fluid boundaries of the external region.
Thermal: solid room boundaries were taken as adiabatic (non-conducting) and on the external region pressure boundaries the incoming air temperature was fixed at 18°C.
Plume sources
For the line-source model, the plume source was a strip 0.1m wide centred on the minor axis and extending across the complete width of the room.
For the point-source model, the plume source was a 0.1 m × 0.1 m square positioned at the centre of the room.
In both cases, heat source strengths of 200 W and 1000 W were considered.
Opening areas
In the 2D line-source case, the openings consisted of horizontal slots extending across the complete width of the space.
For the 3D point-source case, the openings were of square cross-section centred on the major-axis of the room.
The openings were in the ceiling and floor of the enclosure, as in the experiments of Linden et al. (1990).
Buoyancy model
The Boussinesq approximation was made.
Turbulence models
Two different two-equation eddy viscosity turbulence models were used: the "standard" k – ε model of Launder & Spalding (1974) and the more recent RNG k – ε model (Yakhot et al. 1992). The details of the implementations of these models used are given in the appendix.
Radiation
Radiative heat transfer was not modelled.
Computational Procedure
The simulations used CFX-F3D v. 4.1. (AEA 1995), a finite volume CFD code solving the conservation equations for momentum, mass and enthalpy. Hybrid differencing was used for momentum and enthalpy, and central differencing for mass. Default under-relaxation factors used were for mass: 1.0; momentum: 0.65; enthalpy: 1.0; k: 0.7; ε 0.7. The SIMPLEC algorithm was used for pressure correction.
Convergence criteria
Two convergence criteria were applied:
1) absolute values of variables at a user-defined monitoring point did not change by more than 0.1% over the order of 20 iterations.
2) the enthalpy residual was less than 1% of the total heat entering the domain
It was found to not be possible to meet these convergence criteria using the default under relaxation factors running in standard steady-state mode. In order to achieve convergence, it was necessary to use false time stepping. The procedure used was to first run the simulation at steady state with default under relaxation to achieve a nearly converged solution (stage 1), then continue to full convergence using false time stepping (stage 2). Typical numbers of iterations used for stages 1 and 2, respectively, were: point-source: 1000 and 4000 iterations (Cook 1998); point-source: 2000 and 2000 iterations (Cook & Lomas 1998). For the false time stepping, a time step of 0.1s for momentum was used. The size of this timestep was established by trial and error, but was approximately equal to the ratio of the smallest lengthscale to the largest velocity magnitude in the flow.
Computational mesh
2D Line-source: Standard mesh used was 65(L)×90(H)×1(W) cells.
Sensitivity analyses were carried out (Cook 1998) with mesh dimensions from 38(L)×44(H) to 157(L)×210(H). It was found that the standard mesh gave relatively mesh-independent results provided a resolution of at least 1 cm ×1 cm was used in region occupied by the plume. However, reasonable qualitative results could be obtained with the lower resolution meshes. Sensitivity tests were also carried out with the standard mesh but reduced resolution (using non-orthogonal cells) in the external flow domain; it was found difficult to achieve convergence with this mesh.
3D Point-source: 46(L)×90(H)×21(W) cells, with local refinement at plume source (Cook 1998) and 40(L)×90(H)×16(W) cells (Cook & Lomas 1997). No further sensitivity studies were carried out.
© copyright ERCOFTAC 2004
Contributors: Jake Hacker - Arup


