UFR 2-03 Test Case: Difference between revisions
m (Dave.Ellacott moved page SilverP:UFR 2-03 Test Case to UFR 2-03 Test Case over redirect) |
|||
| (3 intermediate revisions by the same user not shown) | |||
| Line 30: | Line 30: | ||
The Fig. 1. shows a symmetric NACA64A010 aerofoil. The sketch on Fig. 2. illustrates the schematics for pitching. For NACA64A010 (NASA AMES Model), the theoretical profile can be found in ref [4] and experimental model coordinates in ref [5]. (The ordinates are tabulated in Table 2 page 5 of ref [5]). The chord length = 0.50 m. Pitching is about 0.25 chord point. The angle of incidence α(t) is defined by the function: | The Fig. 1. shows a symmetric NACA64A010 aerofoil. The sketch on Fig. 2. illustrates the schematics for pitching. For NACA64A010 (NASA AMES Model), the theoretical profile can be found in ref [4] and experimental model coordinates in ref [5]. (The ordinates are tabulated in Table 2 page 5 of ref [5]). The chord length = 0.50 m. Pitching is about 0.25 chord point. The angle of incidence α(t) is defined by the function: | ||
<center><math>\alpha(t)=\left.\alpha_0\right.+\alpha_m\sin(\omega t)</math></center> | <center><math>\alpha(t)=\left.\alpha_0\right.+\alpha_m\sin(\omega t)</math></center> | ||
where α<sub>0</sub> and α<sub>m</sub> are the pitch angle and mean angle amplitude of the harmonic oscillation, respectively. The reduced frequency of the oscillation ''k'' is defined for aerofoils by: | where α<sub>0</sub> and α<sub>m</sub> are the pitch angle and mean angle amplitude of the harmonic oscillation, respectively. The reduced frequency of the oscillation ''k'' is defined for aerofoils by: | ||
<center><math>k=\frac{\omega c}{2U_\infty}</math></center> | <center><math>k=\frac{\omega c}{2U_\infty}</math></center> | ||
where ''c'' is the aerofoil chord, ω is the angular frequency of the oscillation and U<sub>∞</sub> is the free-stream velocity. | |||
where ''c'' is the aerofoil chord, ω is the angular frequency of the oscillation and ''U<sub>∞</sub>'' is the free-stream velocity. | |||
=== Flow Characteristics === | === Flow Characteristics === | ||
| Line 52: | Line 55: | ||
== Experimental Data == | == Experimental Data == | ||
[[Image:U2-03d32_files_image010.jpg]] | <center>[[Image:U2-03d32_files_image010.jpg]]</center> | ||
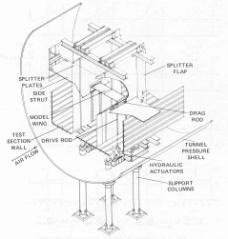
<center>''Figure 3. General arrangement of oscillating airfoil test apparatus''</center> | |||
<center>''in NASA Ames 11- by 11- Foot Transonic wind Tunnel [6].''</center> | |||
The original version of this figure was first published by the Advisory Group for Aerospace Research and Development, North Atlantic Treaty Organization (AGARD/NATO) in AGARD R-702 Compendium of Unsteady Aerodynamic Measurements, S.S. Davis, Data set 2, NACA 64A010 (NASA Ames Model) Oscillatory Pitching, p.2-1, August 1982, reproduced with permission) | The original version of this figure was first published by the Advisory Group for Aerospace Research and Development, North Atlantic Treaty Organization (AGARD/NATO) in AGARD R-702 Compendium of Unsteady Aerodynamic Measurements, S.S. Davis, Data set 2, NACA 64A010 (NASA Ames Model) Oscillatory Pitching, p.2-1, August 1982, reproduced with permission) | ||
Latest revision as of 19:35, 11 February 2017
Flow around oscillating airfoil
Underlying Flow Regime 2-03 © copyright ERCOFTAC 2004
Test Case
Brief description of the study test case
Geometry with Sketch

(The original version of this figure was first published by the Advisory Group for Aerospace Research and Development, North Atlantic Treaty Organization (AGARD/NATO) in AGARD AR-156, S.R. Bland, AGARD Two-dimensional Aeroelastic Configurations, August 1979, [5], reproduced with permission)

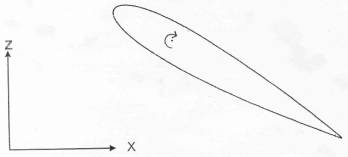
The Fig. 1. shows a symmetric NACA64A010 aerofoil. The sketch on Fig. 2. illustrates the schematics for pitching. For NACA64A010 (NASA AMES Model), the theoretical profile can be found in ref [4] and experimental model coordinates in ref [5]. (The ordinates are tabulated in Table 2 page 5 of ref [5]). The chord length = 0.50 m. Pitching is about 0.25 chord point. The angle of incidence α(t) is defined by the function:
where α0 and αm are the pitch angle and mean angle amplitude of the harmonic oscillation, respectively. The reduced frequency of the oscillation k is defined for aerofoils by:
where c is the aerofoil chord, ω is the angular frequency of the oscillation and U∞ is the free-stream velocity.
Flow Characteristics
For the chosen test case M=0.796, Re=1.3x10⁷, k =0.2002, α0 = 0 deg (with pivot angle fixed, the pitch angle is equivalent to the aerofoil's incidence angle), αm =1.01 deg. The pivot point of the harmonic oscillation in pitch was fixed at (X/chord)rot = 0.248 and the trip was placed at (X/chord)trip = 0.1.
This is a transonic flow regime; hence the shocks are present on the aerofoil. The nonlinear unsteady characteristics of the surface pressures manifest themselves in shock movement and variation in shock strength. The position of the shock locus changes in a close to sinusoidal manner during the harmonic oscillation and is sensitive to the shock boundary-layer interaction. At the maximum angle of attack α=1 deg a supersonic region is present on the upper surface that terminates in a shock located at X/chord=0.55 [11]. As the angle of attack decreases the flow speed gradually decreases on the upper surface, with corresponding increases in pressure. At the same time the shock strength decreases. On the lower surface the flow speed increases, resulting in lower surface pressures and the flow pattern is reversed. There is no separation in this case.
Main Assessment Quantities
Considering the experimental data available the main assessment quantities are time histories (hysteresis) of Cl(t) — lift coefficient and Cm(t) — overturning moment coefficient with respect to the pivot point.
Experimental Data

The original version of this figure was first published by the Advisory Group for Aerospace Research and Development, North Atlantic Treaty Organization (AGARD/NATO) in AGARD R-702 Compendium of Unsteady Aerodynamic Measurements, S.S. Davis, Data set 2, NACA 64A010 (NASA Ames Model) Oscillatory Pitching, p.2-1, August 1982, reproduced with permission)
Experimental data is available in ref [6] - CT (Computational Test) CASE No 6, DYNAMIC INDEX 55. This test case had been identified in ref [6] as one of the most important preferred cases for investigation of oscillating aerofoils. The general arrangement of oscillating test apparatus copied from ref [6] is shown in Fig. 3. A series of experimental measurements has been carried out in NASA AMES 11x11ft transonic wind tunnel. The test Mach numbers ranged between 0.5 to 0.8, and Reynolds numbers between 2.5x10⁶ to 13. x 106. More details about the experimental facility can be found in [8].
The measuring technique is as follows: the pressure histories during the oscillations were experimentally measured. 20 orifices in midspan were used on the upper and 20 on the lower surfaces. Location of orifices is tabularised in ref [8]. The measuring system used strain-gauge-type minature pressure transducers, installed close to orifices with minimum cavities. Type of transducer- kulite model XCQL-7A-093. The unsteady aerodynamic forces were obtained subsequently form integration of pressure providing histeresis of instantaneous lift and moment coefficients and instantaneous surface pressure (pressure coefficient) distributions. (Also, for both upper and lower surfaces steady data for pressure coefficient is given). All data is available clearly in a form of tables in ref [6].
The experiment has been designed to provide validation data for CFD codes which allow for mild shock-wave/boundary layer interactions. The discussion about uncertainties of this experimental data is very detailed, complex and extensive and it is best to read it in full together with hints for possible interpretations (22 pages) in ref [10]. Howerer it can be mentioned that callibrations were performed on-line, and up to 2% change in static sensitivity before and after run were allowed. Accuracy of the motion was 1%. The following comments on the measured data accuracy are made: Mach number +- 0.002, steady incidence+- 0.05 deg, reduced frequency +- 0.005, steady pressure coefficients 1%, unsteady pressure coefficients 2%. There was no evidence of undue sensitivity to small changes in parameters, spanwise variations were probably very small. There was minimal influence on model distortion, no corrections were made for wall interference.
The information on the walls of the wind tunnel needed for the boundary conditions is as follows: test section dimensions are 3.35 x 3.35 x 6.7 m roof, floor and side walls are baffled slots. The wind tunnel was closed with variable density. The model was mounted between splitter plates. Thickness of side wall boundary layer was very thin due to splitters, thickness of boundary layer at roof and wall was approx 7.6 cm.
Uniformity of Mach number over the test section was +- 0.002 (measured using static taps on splitters). Sources of levels of noise or turbulence in empty tunnel were not investigated. There were none tunnel resonances noted. The model was moved using four graphite epoxy push-pull rods with diferential motion of forward and aft pair. Purity of applied motion pure sinusoids. Static and dynamic elastic distortion during test were not measured.
CFD Methods
The CFD methods are given in the evaluation section.
© copyright ERCOFTAC 2004
Contributors: Joanna Szmelter - Cranfield University

