UFR 4-11 Test Case: Difference between revisions
| Line 83: | Line 83: | ||
and the dissipation (assuming local equilibrium) from | and the dissipation (assuming local equilibrium) from | ||
{{DisplayEquation|eqn=\ | {{DisplayEquation|eqn=\epsilon=C_\mu^{\ 3/4}\ k^{\ 3/2}/L}} | ||
<!--<center>[[Image:U4-11d32_files_image008.gif]] </center>--> | <!--<center>[[Image:U4-11d32_files_image008.gif]] </center>--> | ||
Revision as of 12:04, 27 September 2011
Simple room flow
Underlying Flow Regime 4-11 © copyright ERCOFTAC 2004
Test Case
Brief description of the study test case
The simulation of isothermal, forced ventilation in a simple room geometry is the subject of this Underlying Flow Regime. Experimental data are drawn from a series of experiments conducted as part of the ‘Annex 20, Air Flow Patterns within buildings’ project of the International Energy Agency (IEA) (http://www.hptcj.or.jp/annex20/index.html).
Experiments were conducted by a number of different participants, for the same test room geometry (see fig2-01.gif).
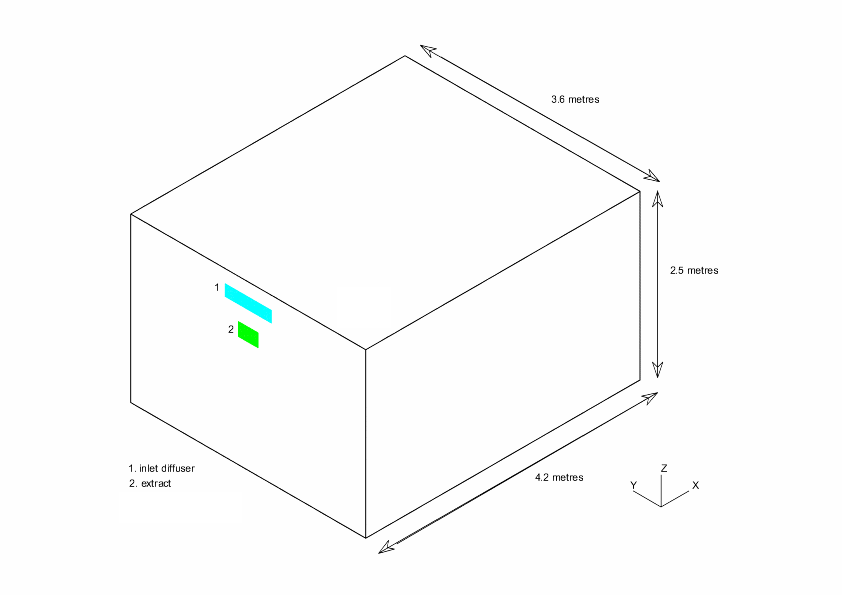
The test room was an orthogonal box, 4.2m long, 3.6m wide and 2.5m high. It was ventilated by forced flow through a diffuser mounted on the rear wall, 0.2m below the ceiling. The extract was positioned below the diffuser, 1.7m above the floor, and is 0.3mx0.2m in size. The diffuser (HESCO type KS) consisted of 4 horizontal rows of 21 nozzles (each 12mm diameter, length 15mm), which were arranged within a 0.71mx0.71m rectangle and were set at an angle of 40° to the horizontal, pointing towards the ceiling.
The test case was designed to assess the effectiveness of CFD in modelling comfort and ventilation efficiency, which are the main ventilation system design parameters. The ventilation flow pattern generated in the test enclosure is typical of modern air terminal device design. A range of ventilation rates were modelled, and measurements correspond to steady‑state flow conditions.
Measured quantities, to be used for the purpose of CFD evaluation, are:
- mean and turbulence velocities at various locations within the room.
- bulk flow parameters, such as the average air speed and turbulence, for the 'occupied zone'. The occupied zone is the interior of the test room and is defined as the region up to a height of 1.8m from the floor and to within 0.6m of the walls.
The results database for Annex 20 is not available on the internet, but can be purchased through ECBCS Annex Publications (http://www.hptcj.or.jp/annex20/index.html).
Test Case Experiments
The test case experiments considered in this review are measurements of mean and turbulence velocities reported by Fontaine et al. (1991), Heikkinen et al. (1991), and Lemaire (1992), for two air flow rates:
- 1.5 Air Changes per Hour (ACH)
- 3.0 Air Changes per Hour (ACH)
The experiments were designed for CFD model validation, and the original intention was that all the experimenters should conduct a standard set of experiments. In the event, however, different experimenters concentrated on different aspects of the problem. Some limited their attention to measuring the details of the jet and diffuser characteristics, whilst others made measurements throughout the domain.
Particularly detailed model scale experiments were conducted by Fontaine et al (1991) using a 1/6th scale model with water as the fluid, and both flow visualisation and velocity measurements were carried out. The velocity and turbulence measurements were made using Laser Doppler anemometry. The majority of the other contributors made measurements on the full scale test room, an example being the results of Heikkinen (1991).
A summary description of the experimental setup and techniques used can be found in Lemaire (1992). The aim of the experimental campaign was to use the latest available measurement techniques to provide reliable datasets for CFD validation, and all experimental work was evaluated and peer reviewed. A detailed assessment of the accuracy of measured quantities for each measurement technique is not explicitly provided within the summary papers mentioned above, but relevant references to more detailed, published research papers (‘Research Items’) on the experiments carried out by each investigator are cited in the review by Lemaire (1992).
CFD Methods
CFD simulations were carried out to simulate the flow field for the test cases described above. Several partners in the IEA exercise carried out CFD simulations, using a variety of schemes (Lemaire, 1992). We will focus however on the simulations Atkins carried out independently of the above project, for the UK Health and Safety Executive (HSE) (Gilham et al., 1995). The reason for this choice is that complete and detailed information exists on all aspects of those simulations, which include sensitivity runs designed to help assess various CFD modelling options (mesh dependence, sensitivity to boundary conditions, different turbulence and wall modelling approaches).
The commercial industrial CFD code STAR-CD was used to solve the steady-state Reynolds Averaged Navier-Stokes equations for the flow. The SIMPLE solver was used and for most simulations the turbulence model employed was the standard k-ε model with wall functions (Launder and Spalding, 1974). Additional runs were also carried out using the RNG variant of the k-ε model (Boyson, 1993), and a two-layer model, which combined the standard k-ε model in the bulk of the flow with a k-l model in the near wall regions. The mesh refinement was varied between 15,000 and 165,000 cells; embedded mesh refinement was added to sensitive areas in the flow, for a subset of the runs. The representation of the inlet and outlet boundaries was also varied, to test the sensitivity of the results.
Details of the CFD modelling strategy are discussed in the sections that follow.

Table 1 Summary of Ventilation Flow Simulations
Grid Structure and resolution
To reduce the computational effort required for these simulations, only one half of the test room was modelled, since the test room and its boundary conditions are symmetrical. A vertical plane of symmetry was assumed at y=0 and all other boundaries were treated as smooth solid walls. An example of a solution mesh is shown in fig2-02.gif. The particular mesh shown has 92,128 hexahedral computational cells distributed in an essentially Cartesian format, with a region of local mesh refinement around the diffuser inlet and outlet. Calculations were carried out on a number of different grids with the total number of cells ranging from 15,120 to 164,550, though all grids had the same basic format as that described above. One characteristic of most of these meshes was that the mesh size near the wall was relatively coarse. The minimum cell dimensions near the wall were limited in order to maintain the non-dimensional near‑wall distance, y+ within appropriate limits for the use of wall functions; in near-wall regions where the flow speeds are low, keeping y+ above the lower limit requires relatively large near-wall cells.
Boundary Conditions
A no‑slip boundary condition was imposed on all the solid walls. The method of imposing this condition was dependent on the form of the turbulence model used for the particular simulation. For both the high Reynolds number k-ε models, wall boundary conditions were introduced using a wall function. In this, the no-slip boundary condition is introduced indirectly by setting the velocity in the near-wall computational cell.
For the two layer model, the situation is slightly different, since the momentum equations are solved right down to the wall and thus the no-slip condition is imposed directly. This method does, however, require a significantly finer mesh in the near-wall region.
The outflow velocity was set to fulfil overall continuity, and zero derivative conditions were assumed for all variables. To guarantee a zero gradient outlet condition it is best to avoid placing the outlet boundary at the wall outlet location where flow acceleration and shear zones may be present. For Run-05, an elongated ‘outlet duct’ of computational cells was added to the outlet location, to ensure that the flow reaching the outlet boundary (placed at the other end of the duct) did not have any stream-wise variation.
The inlet boundary was particularly difficult to model as it had to represent the details of the diffuser. It is possible to model the diffuser nozzle geometry explicitly, but this is not particularly practicable since an extremely high level of mesh refinement would be required to define all the geometrical features. A more pragmatic approach is to represent the effect of the diffuser with an equivalent, simplified boundary condition. Considerable effort was devoted to defining appropriate inlet conditions during the CFD modelling activities of the IEA programme, and a variety of approaches were examined by several Annex 20 participants (e.g. Chen and Moser (1991), Ewert et al (1991), Skovgaard (1991) and Heikkinen (1991b)). Basic slot models, momentum models, box models and prescribed velocity models were all considered, as summarised by Lemaire (1992). For most of the simulations presented here, the momentum model method was adopted, as described below.
The momentum model provides a consistent set of values for the inflow mass and momentum boundary conditions. The area of the opening was selected to be the complete diffuser area i.e. 0.71m x 0.17m, and the inlet velocity, and hence momentum, was calculated by assuming an effective total inlet area for all 84 nozzles. The effective total areas, which were determined experimentally, were taken to be 0.008m2 for the 1.5 ach simulation and 0.00855m2 for 3.0ach, giving supply velocities of 1.975m/s and 3.68m/s respectively. The difference between the effective areas is caused by a change in the discharge coefficient with flow rate. Within the computational model, the inlet boundary conditions were imposed by defining sub‑grid scale mass and momentum sources. A layer of cells next to the wall and covering the diffuser area was selected and an appropriate mass source term introduced. Additional terms, based on the mass inflow and the supply velocity, were added to the momentum equations, and the turbulence levels were also fixed within these cells. The turbulent kinetic energy, k, was set assuming a turbulence intensity I = 10%, which is typical for such jet diffusers, as described by Heikkinen (1991b). The value for the dissipation, ε, was based on fully developed channel flow, using a length scale L = 0.0023m, corresponding to the typical size of individual diffuser inlet nozzles, again as used by Heikkinen. The value of the turbulent kinetic energy was then calculated from

and the dissipation (assuming local equilibrium) from

where Cμ = 0.09 is an empirical constant.
Differencing Scheme
Three differencing schemes were used, namely first order 'upwind differencing' (UD), second order 'linear upwind differencing' (LUD), and the 'self-filtered central differencing' (SFCD) scheme. The UD scheme is computationally cheaper than the other two schemes, but can introduce excessive numerical dispersion. The LUD scheme is unbounded and can introduce non‑physical under or over-shoots. The SFCD scheme blends the standard second order central differencing scheme with the first order upwind differencing scheme, the blending factor being derived from local gradients. It is bounded and so does not introduce non‑physical behaviour. In this study, only the higher order SFCD scheme was used.
© copyright ERCOFTAC 2004
Contributors: Steve Gilham; Athena Scaperdas - Atkins