UFR 2-07 Evaluation
3D flow around blades
Underlying Flow Regime 2-07 © copyright ERCOFTAC 2004
Evaluation
Comparison of CFD calculations with Experiments
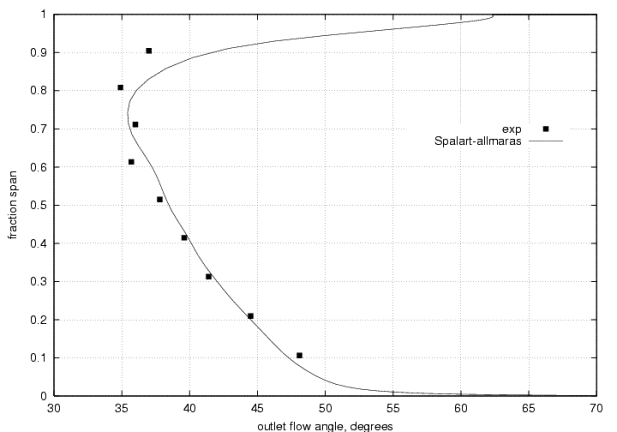
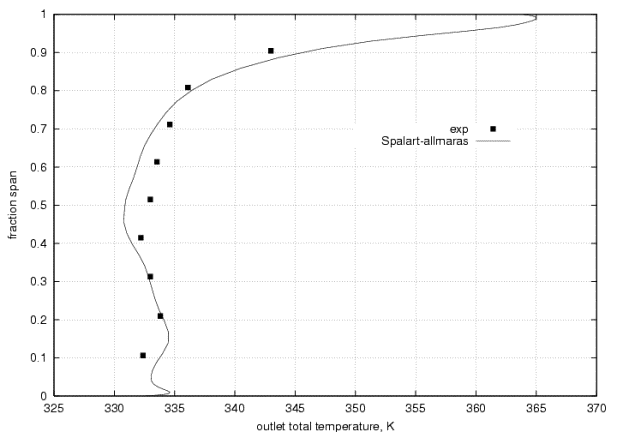
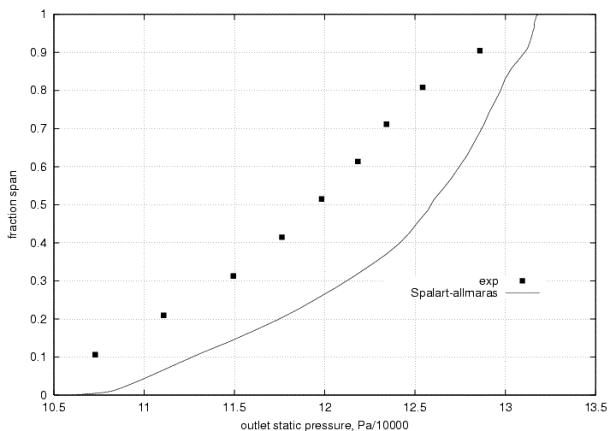
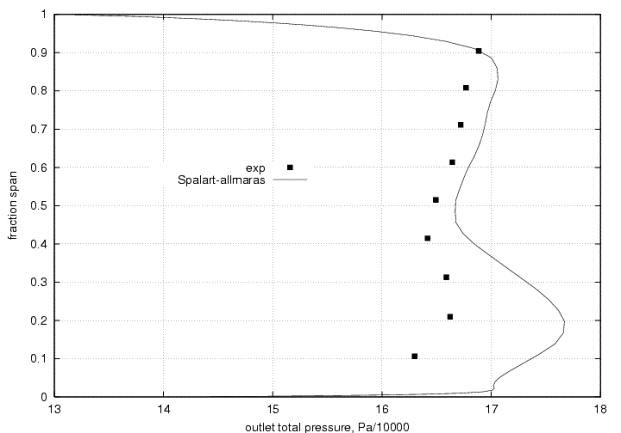
Figures 8 through 11 show graphical comparisons of the outlet conditions in the experiment and those predicted. The experimental outlet conditions were measured with a probe rather than using LV.
The flow angle shown in Figure 8 was reasonably predicted, however, noticeable differences are seen near the blade tip. This is likely explained by the increasing influence of shock structure in the transonic tip region of the domain. Another possible explanation is the open tip gap approximation.
The total temperature as shown in Figure 9 shows good agreement at all radial locations.
The static pressure, however, does not show good agreement between experiment and simulation. At all radial locations an offset is seen between measured and predicted data. This shift is less pronounced in the tip region, because the casing pressure is taken from the measured pressure. It is interesting to note that the same kink is seen near the casing in both the experiment and the computation. It appears the the tip leakage jet effects both data sets in the same region. A more prudent selection of an ‘input’ pressure for the radial equilibrium equation might have been the hub pressure, which was not largely unsteady due to a leakage jet. Also in question is the ability of a radial equilibrium equation to model flow phenomena aft of a low aspect ratio blade, whose flow is most likely not predominantly two-dimensional. In the radial equilibrium model, the casing pressure is fixed and the spanwise back pressure distribution is computed through balancing pressure and inertial forces. Terms involving streamline radii and forces and velocities along the streamline are neglected, as the aspect ratio is assumed to be large. However this rotor's aspect ratio is not especially large, so the choice of radial equilibrium for the back pressure is suspect. Equally suspect is the value chosen for the casing back pressure, from which the entire spanwise distribution is extrapolated. Blockage effects may have hindered the probe's capability in the casing area, as indicated in Figure 4.
The total pressure shows considerable disagreement especially in the subsonic near root region of the blade. It was originally thought that the experiment must have an area of separation around 20% span which would not be accurately predicted by Navier-Stokes solvers. However, the velocity vectors shown in Figure 11b indicate that the flow is attached everywhere on the suction side of the rotor at 20% span. It seems, therefore, that the unchoked region of the span, namely the inner-half, is largely erred due to the offset in outlet static pressure. This offset has the non-linear effect of influencing the mass flow in subsonic region and size of the subsonic region, whereas the total pressure and mass flow in the choked supersonic region cannot be affected by the back pressure.

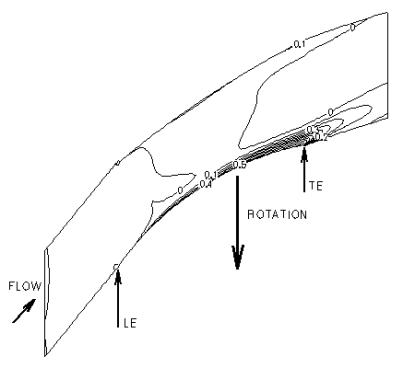
The data in [1] includes also field data in graphical form resulting from Laser Velocimetry (LV). One must note that the LV measurements in this data set include only tangential and axial velocity components. An accurate comparison therefore comprises of Mach numbers computed with and without radial velocity components. The experimenters claim (through their own computations) that flows in the radial direction did not influence the field Mach numbers. However, our own computations, shown in Figure 12, indicate a different conclusion. Indeed the free-stream, where inertial rather than viscous effects predominate, flow in the radial direction plays almost no role. In the highly viscous regions of the S1 view, namely the boundary layer and the wake, the radial flow amounts to up to half of the total flow. Comparisons of the field Mach number at the near-peak-efficiency condition are shown in Figures 13 through 15.
When comparing computations with LV results, one must be aware of the fact that LV apparatae are not capable of taking near-wall measurements because of reflection problems. Within a critical distance to the blade, therefore, the free-stream velocity is extrapolated to the wall, which falsely indicates the absence of a boundary layer. Detailed descriptions of the data processing techniques can be found in reference [8].
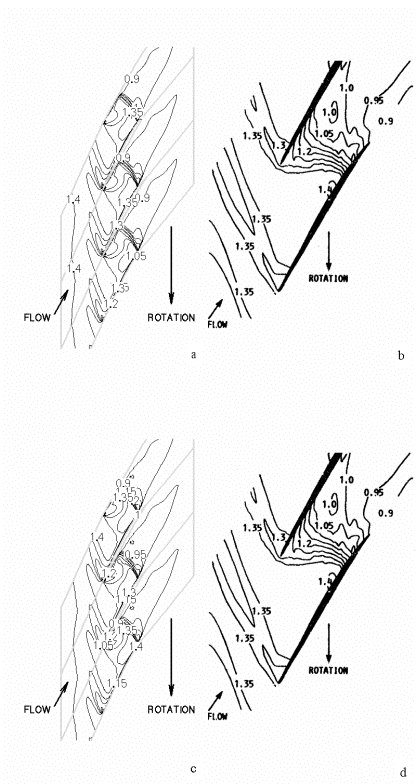
Near the blade tip the effect of including or excluding the radial flow component does not seem to be large. This is probably an example of wall-bounded flow, whose behavior is necessarily parallel to the casing. Figure 13 shows the same S-1 plane at 90% span.
In all four plots in Figure 13, one sees the slight effect of the tip gap flow, evidenced by the region of high Mach number near mid-chord. The tip gap flow is thus supersonic and has a definite effect on the shock location at this radial station.
The shock occurs in the experiment at 90-95% chord. For the computed case where radial flow is neglected in the calculation of the Mach number, the shock occurs at 88% chord (Figure 13a), whereas the shock location is predicted to be at 86% chord if one includes radial flow in the reporting of the Mach number (Figure 13c).
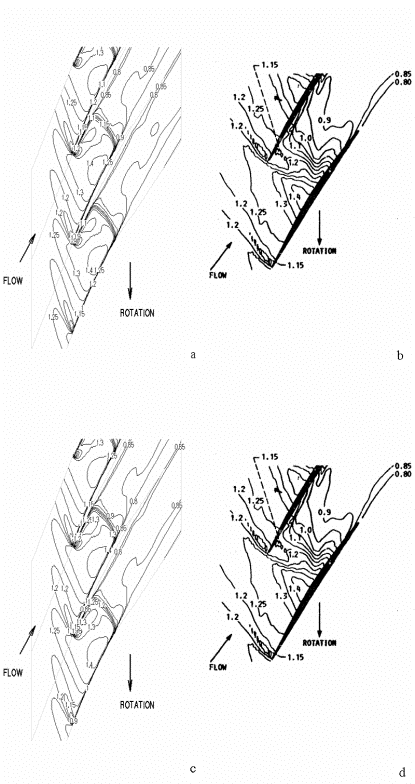
At the more central radial location shown in Figure 14, the effect of radial flow on shock location is less pronounced; however, its effect on the location of Mach contours is (qualitatively) slightly more pronounced. One sees slightly different contour shapes in the wake and boundary layer regions. This agrees with the notion suggested by Figure 12, that the radial flow component predominates in the highly viscous regions of the flow. Figure 14 shows the Mach number distribution at 70% span in the computations and experiments. Whereas the shock occurs at around 80% chord in the experiment, the shock location is predicted at 83% chord when one excludes the radial flow component (Figure 14a) and with the inclusion of three orthogonal flow components the shock location is calculated to be at 84% chord (Figure 14c). As in the 90% span case, the shock location is more closely predicted by neglecting the radial flow component.
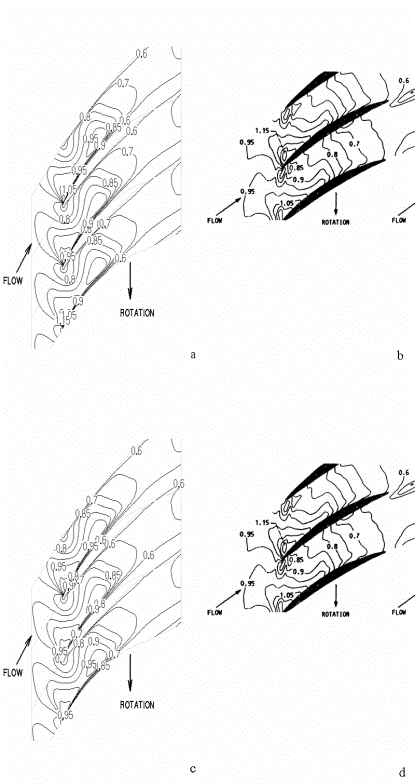
At 30% rotor span, as detailed in Figure 15, the flow is completely subsonic and thus quantitative comparisons of the field Mach numbers is more challenging. In all four plots one sees the locally supersonic flow near the leading edge, along with a quasi-isentropic deceleration over the rotor blade. Despite the notion supported by Figure 12 that the radial flow component has a large influence on the flow in the boundary layer and wake, the discrepancies between Mach number calculations including and excluding the radial flow component are not noticeable between Figures 15a and 15c. One can safely conclude that the radial flow component has the strongest influence on viscous, supersonic flows, and its inclusion is imperative for deeper understanding of flow phenomena (in particular, shock locations) at transonic spanwise locations.
© copyright ERCOFTAC 2004
Contributors: William Anderson - ALSTOM Power (Switzerland) Ltd