UFR 2-06 Test Case: Difference between revisions
| Line 77: | Line 77: | ||
For transonic flow through the blade cascade, the governing parameters are the inlet Mach number, the inlet flow angle, the isentropic outlet Mach number, and the outlet Reynolds number based on the profile chord. The tunnel allows the measurement in the turbine cascades within the range of exit Mach numbers (0.5; 2) and inlet angles β<sub>1</sub> (30; 150) deg. The flow in the blade cascade was investigated within a wide range of exit Mach numbers and inlet angles by the Mach-Zehnder interferometer. Test data are based on interferometric pictures taken for various flow conditions. The density difference between two adjacent fringes is given by the wavelength of monochromatic light and the wind tunnel width by the relation Δρ = 0.011858 kg/m<sup>3</sup>. Detailed description of the evaluation procedure is given by Šafařík (1996). | For transonic flow through the blade cascade, the governing parameters are the inlet Mach number, the inlet flow angle, the isentropic outlet Mach number, and the outlet Reynolds number based on the profile chord. The tunnel allows the measurement in the turbine cascades within the range of exit Mach numbers (0.5; 2) and inlet angles β<sub>1</sub> (30; 150) deg. The flow in the blade cascade was investigated within a wide range of exit Mach numbers and inlet angles by the Mach-Zehnder interferometer. Test data are based on interferometric pictures taken for various flow conditions. The density difference between two adjacent fringes is given by the wavelength of monochromatic light and the wind tunnel width by the relation Δρ = 0.011858 kg/m<sup>3</sup>. Detailed description of the evaluation procedure is given by Šafařík (1996). | ||
The basic series was made for the inlet angle β<sub>1</sub> = 70.7 deg with the exit isentropic Mach numbers changed in the range (0.489, 1.387). The measurement covers the values from low subsonic to supersonic exit velocities including the transonic region. Additional experiments were carried out for extreme values of incidence i = 70.7−β<sub>1</sub> covering the range from i = −67 deg (very small loading) to i = +30 deg (overloading conditions). | The basic series was made for the inlet angle β<sub>1</sub> = 70.7 deg with the exit isentropic Mach numbers changed in the range (0.489, 1.387). The measurement covers the values from low subsonic to supersonic exit velocities including the transonic region. Additional experiments were carried out for extreme values of incidence i = 70.7 − β<sub>1</sub> covering the range from i = −67 deg (very small loading) to i = +30 deg (overloading conditions). | ||
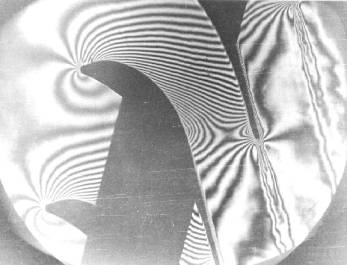
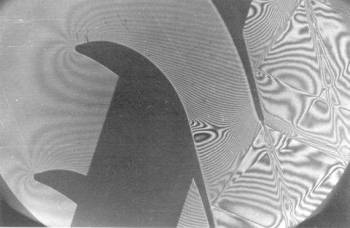
Two flow regimes were chosen as test cases for the comparison of numerical simulations with experimental data: a) the transonic regime with M<sub>2is</sub>=1.198 corresponding to nearly design conditions; b) the subsonic regime with M<sub>2is</sub>=0.716. The interferograms of the flow fields in the blade cascade are shown in Fig.2 and 3. | Two flow regimes were chosen as test cases for the comparison of numerical simulations with experimental data: a) the transonic regime with M<sub>2is</sub>=1.198 corresponding to nearly design conditions; b) the subsonic regime with M<sub>2is</sub>=0.716. The interferograms of the flow fields in the blade cascade are shown in Fig.2 and 3. | ||
Revision as of 09:20, 17 April 2010
Flow around (airfoils and) blades (transonic)
Underlying Flow Regime 2-06 © copyright ERCOFTAC 2004
Test Case
Brief description of the study test case
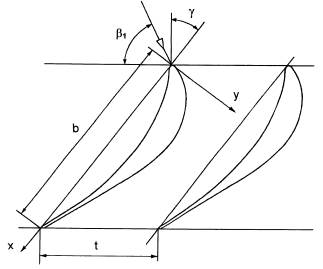
The SE 1050 turbine blade cascade was designed at ŠKODA Plzeň for transonic operational conditions, and represents a section view of the rotor blade of the last stage of a steam turbine of large output. The scheme of the cascade is given in Fig.1. The basic data of the cascade are given in Table 1. The blade cascade with profile coordinates is described in detail by Šťastný, Šafařík (1990).
|
chord b |
100 mm |
|
blade span |
160 mm |
|
pitch t |
55.12 mm |
|
stagger angle γ |
37.11 deg |
|
number of blades |
8 |
|
inlet angle β1 |
70.7 deg |
|
incidence angle i |
0 deg |
The suction side of the profile is designed to produce supersonic compression where the transition of the laminar boundary layer occurs near the beginning of the rear straight part. The trailing edge at the pressure side is designed to suppress the inner branch of the exit shock wave, see Šafařík et al. (2003).
The flow regime near design conditions at low incidence is characterised by a strong acceleration in the cascade without separation, by the laminar/turbulent transition at the supersonic compression on the suction side, and by exit shock waves at the trailing edge. The flow is accelerated from low subsonic velocities (M1 = 0.375). The sonic line crosses the blade passage. Aerodynamic choking bears on the existence of maximum mass flux density of a compressible fluid flow.
The supersonic compression accompanying transonic expansion occurs at approximately half of the chord of the suction side. The compression is a consequence of the discontinuity of the curvature of the suction side surface at the point of velocity decrease. This local supersonic compression induces the transition to the turbulent boundary layer. From this it follows that great sensitivity of transonic flow to small geometry differences in flow conditions.
Exit shock waves forms downstream of the trailing edge of the profile. Their external branch passes through the flow field downstream of the cascade. The internal branch of exit shock waves reflects on the suction side of the neighbour blade in a regular reflection structure. The turbulent boundary layer on the suction side is more resistant to the separation at the interaction with the internal branch of the exit shock waves. The wakes behind the trailing edge of profiles are relatively thin.
Test Case Experiments
Measurements were carried out in the wind tunnel in the High-Speed Laboratory of the Institute of Thermomechanics AS CR in Prague. The blown-down wind tunnel connected to the vacuum storage has a turnable test section that is 160 mm in width and 220 – 600 mm in height depending on the cascade stagger. Measurements were performed using a blade cascade consisted of 8 profiles CE 1050 (chord b = 0.1 m, length h = 0.16 m). The maximum error of inlet angle setting is 0.1 deg. The experimental facility provides the possibility of pneumatic and optical measurements in the range of Mach numbers up to M ≈ 2. The tunnel is equipped with a Mach-Zehnder interferometer (mirror Ø 156 mm) and schlieren optics, both can be used either with a nanosecond spark source or a Video system. A semi-automatic traversing device together with a digital measuring system is used to measure cascade losses as well as other aerodynamic data.
For transonic flow through the blade cascade, the governing parameters are the inlet Mach number, the inlet flow angle, the isentropic outlet Mach number, and the outlet Reynolds number based on the profile chord. The tunnel allows the measurement in the turbine cascades within the range of exit Mach numbers (0.5; 2) and inlet angles β1 (30; 150) deg. The flow in the blade cascade was investigated within a wide range of exit Mach numbers and inlet angles by the Mach-Zehnder interferometer. Test data are based on interferometric pictures taken for various flow conditions. The density difference between two adjacent fringes is given by the wavelength of monochromatic light and the wind tunnel width by the relation Δρ = 0.011858 kg/m3. Detailed description of the evaluation procedure is given by Šafařík (1996).
The basic series was made for the inlet angle β1 = 70.7 deg with the exit isentropic Mach numbers changed in the range (0.489, 1.387). The measurement covers the values from low subsonic to supersonic exit velocities including the transonic region. Additional experiments were carried out for extreme values of incidence i = 70.7 − β1 covering the range from i = −67 deg (very small loading) to i = +30 deg (overloading conditions).
Two flow regimes were chosen as test cases for the comparison of numerical simulations with experimental data: a) the transonic regime with M2is=1.198 corresponding to nearly design conditions; b) the subsonic regime with M2is=0.716. The interferograms of the flow fields in the blade cascade are shown in Fig.2 and 3.
Inlet conditions are characterized by the total pressure and the total temperature upstream the cascade. The flow regime was adjusted by means of the back pressure in the settling chamber downstream the cascade.
Fig.2 Interferogram of the flow field for M2is = 0.716
Fig.3 Interferogram of the flow field for M2is = 1.198
Experimental data that can be used for an assessment of CFD methods are as follows:
- interferograms giving isolines of the Mach number and/or density of the flow field in the blade cascade;
- distribution of the static pressure on the blade surface;
- distribution of the boundary layer parameters on the blade surface;
- mean velocity profile in the wake;
- survey of relevant parameters including exit flow angle and loss coefficient.
The pressure distribution on the profile surface was evaluated from interferometric pictures. Besides, measurements behind the cascade were carried out in the distance one chord behind the cascade for various inlet angles and the Mach numbers. The loss coefficient ζ is given by the relation ![]() where λ2 is the relative velocity.
where λ2 is the relative velocity.
The dependence of Mach number errors on the value of the inlet Mach number was derived for interferometric measurements. The Mach number error can be estimated as δM = 0.005 for the Mach number M ≈ 1. The errors of pressure and temperature were δP = 70 Pa and δT = 0.1 K. The error analysis of the data reduction method for the evaluation of the exit angle and the energy loss coefficient has not been carried out. The maximum error of the exit angle was estimated to be about 0.3 deg.
CFD Methods
Calculations were carried out partly for inviscid flows using numerical solution of Euler equations and partly for viscous turbulent flows using numerical solution of Reynolds-averaged Navier-Stokes equations closed by a turbulence model. The finite volume method solving numerically steady state solution by time dependent method was used in both cases. Convergence to the steady state solution was examined by log L2 residual.
Computational domain is given by one and/or two cascade pitch with profile located inside of the domain. Periodic boundary conditions on the upper-lower boundary have to be prescribed. Inlet boundary conditions are given by total values of flow parameters. Mean flow rate cannot be given as inlet boundary condition. At the inlet boundary, three quantities were given and one was extrapolated. Pressure in the integral form is given at the outlet boundary in the distance 1.5 - 2 chords behind the cascade.
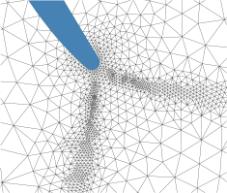
The modern explicit or implicit schemes have been used for solution of the Euler equations and the Navier-Stokes equations (TVD, WENO, ROE, AUSM high order schemes). The H-type grid, multi-block O-H grid, and structured and unstructured triangular grid have been used for numerical simulations. As an example, the adapted unstructured triangular grid used for the leading and trailing edge discretisation is given in Fig.4. The grid has approximately 3-3.5 x 10⁴ cells refined near walls, leading and trailing edge(Dobe et al., 2003).
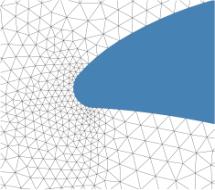
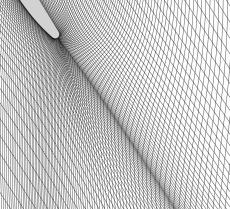
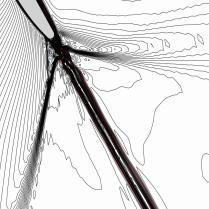
The effect of the grid refinement near the blunt trailing edge was tested for laminar flow (Dobe et al., 2003). The adequate grid refinement of the grid shown in Fig.5 gives shock wave structure comparable with experimental data (lip shocks).
The numerical solution of the RANS equations were carried out for two values of the Mach number M2is using various numerical schemes, grids, and turbulence models. The inviscid calculations were carried out using the same conditions (scheme, grid) for the estimation of the effect of used numerical methods. All the calculations were accomplished for the inlet angle β1 = 70.7 deg. The survey of numerical simulations of subsonic and transonic flow through the cascade SE 1050 is given in Table 2 and 3.
|
authors |
code |
turbulence model |
numerical scheme |
used grid |
|
Dobe et al. (2003) |
in-house code |
Spalart-Allmaras |
ROE scheme 2nd order |
H-type grid generated by TECPLOT |
|
Louda et al. (2003) |
in-house code |
Menter SST, Kato-Launder correction |
AUSM-U scheme 2nd order |
H-type grid generated by TECPLOT |
|
Hyhlík et al. (2003) |
FLUENT 5.0 |
RNG k-eps model |
multistage Runge-Kutta scheme |
H-type grid |
|
|
|
| ||
|
|
|
| ||
|
|
|
|
|
|
|
|
|
|
|
|
|
|
|
|
|
|
|
|
|
|
|
|
Dobe et al. (2003) used the Spalart-Allmaras one-equation model and the ROE scheme of the 2nd order. Louda et al. (2003) used the Menter´s SST model with Kato-Launder modification of turbulence production for calculation of turbulent flow in blade cascade. The code is based on the AUSM-U splitting scheme with van Leer´s limiter. Boundary conditions on the profile were prescribed at the wall in both codes. Wall functions were used as wall boundary conditions in calculations made by the code FLUENT 5.0.
© copyright ERCOFTAC 2004
Contributors: Jaromir Prihoda; Karel Kozel - Czech Academy of Sciences
