UFR 2-05 Test Case
Flow around airfoils (and blades) A-airfoil (Ma=0.15,
Re/m=2x106)
Underlying Flow Regime 2-05 © copyright ERCOFTAC 2004
Test Case
Brief description of the study test case
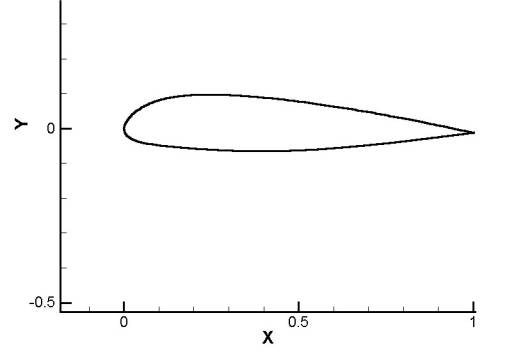
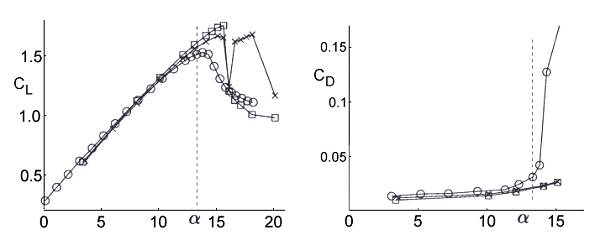
The present case is one of several measured and studied computationally. The chord Reynolds number is Rec=2.07x10⁶ and the Mach number M=0.15, close enough to zero to be considered effectively incompressible but also high enough for compressible CFD methods to be used and the results compared with incompressible methods. The geometry.dat is purely two-dimensional. The case of primary interest, corresponding closely to the maximum lift for the foil, is at an angle of attack of α=13.3°. These conditions are roughly similar to the take-off and landing stall conditions for a small aeroplane like a Cessna Cardinale, though the Reynolds number for the real aircraft would be somewhat higher at about three million.

The case had its origin in a French co-operative research project “Opération Décrochage” driven by Aerospatiale and including ONERA, CERT and IMFT as partners. A complete experimental database was compiled (see below) covering transition, boundary layer development and the separated region. It was noted even at that time that algebraic and k-ε models failed to predict the separation [6].
Test Case Experiments
The Aerospatiale “A” airfoil was designed in 1986. The UFR corresponds precisely to one case measured in the ONERA F2 tunnel at M=0.15 and Rec=2.1x10⁶ measured by Gleyzes [7,8]. The range of angles of attack included α=13.3°, at which the CL was measured to be 1.515. There were also measurements carried out in the F1 tunnel [9,10] where the incidence of 13.1° was measured at Rec=2.07x10⁶, and measurements at Rec= 3.13x10⁶ were gathered.

The results obtained in the F2 tunnel comprise pressure coefficient and skin friction distributions and LDV measurements of velocity and Reynolds stress profiles in the boundary layer and wake. From the latter, δ, δ* and θ distributions were obtained. The laminar bubble leading to transition at 12% chord was identified using oil-flow visualisation. The flow was confirmed to be approximately two-dimensional up to about 13°, but at 13.3° some three-dimensionality may have been beginning to appear, leading to lower CL and higher CD compared to measurements in the F1 tunnel.
CFD Methods
It is recommended that a mesh of at least 256 (wrapped around the foil as a C-mesh, with 2x32 cells in the wake and 192 around the foil) x 64 (in the wall normal direction) is used. The airfoil has a thick trailing edge and it is necessary to close the geometry contour. A C-type mesh of this type was produced in the ECARP project (by Dornier/Dasa-LM) and is provided in the database. They also conducted a grid-dependence study using a superfine mesh of 512 x 128. The results were somewhat surprising in that the laminar bubble was resolved at the suction peak by the superfine mesh and the separation moved back from 84% to 89% using the Johnson-King model. In the light of this, it is recommended that if possible computations with any model should be carried out on a 512 x 128 mesh as well as a 256 x 64 mesh to check grid-dependence.
In the ECARP project, ONERA used adaptive meshing. The resulting adapted meshes are also included in the database for the inspection of those who are interested.
The position of transition appears to be critical to obtaining a reasonable subsequent estimate of the development of the boundary layer and its separation [4]. Treated as a prediction, this is fraught with difficulty in the RANS context. If the reader/user intends to run this test case, the first decision must be whether transition prediction is going to be attempted. If so, the case is first and foremost a test of the chosen transition prediction method. If not, then transition should
be fixed at precisely 12% of chord on the upper surface (also at 40% of chord on the lower surface, though this is far less important). The remaining calculation is then a test of the modelling etc, with transition fixed at the correct position in advance.
We are not prepared to recommend a transition prediction method. DNS is the only reliable approach and is known [3] to get the laminar separation at 12% and the transition process correctly. It is possible that even a 2D pure Navier-Stokes “simulation” could predict the separation point, but at the risk of a totally unphysical “transition” downstream of that point. Adequate resolution will be need to resolve the laminar separation bubble at 12% chord.
An enormous variety of turbulence models have been used on this case (including all variants, about 35 models in the ECARP project alone) covering algebraic, half-equation, one-equation, two-equation, non-linear and second order models. Most partners used RANS codes, while a few made use of viscous-in viscid interaction or other approaches. Some indication of the variety of methods is given by the tables below; the ECARP results are provided in the database (4.7MB).
Aside from fixing (or correctly predicting) the position of transition (dealt with below) there appears to be little clear unambiguous evidence of superiority of any particular model. Second- moment closures have been recommended as superior, but since simpler models can give convincing prediction in some circumstances, perhaps with suitable tuning of parameters, this conclusion cannot be commended as best practice.
|
EUROVAL |
turbulence model |
code employed |
discretisation scheme(s) and solver(s) |
|
BAe |
Baldwin-Lomax, k-ε / Wolfshtein |
||
|
CERFACS |
k-ε / Chien, Algebraic Stress Model |
||
|
NLR |
Baldwin-Lomax, BL-Goldberg |
||
|
SAAB |
Baldwin-Lomax, k-ε / Wolfshtein |
||
|
SAAB/HUT |
Cebeci-Smith |
||
|
TUD |
Cebeci-Smith |
||
|
ECARP |
|||
|
BAe |
Baldwin-Lomax, k-ε / Chien, Bae k-t |
RANSMB |
a finite volume structured multiblock solver, an explicit four-stage Runge-Kutta scheme |
|
DLR |
Johnson-King, Algebraic Stress Model:Yakhot-Orszag |
DLR ViB Code |
a multi-grid Navier-Stokes solver, using a cell-centered finite-volume Runge-Kutta method |
|
Dornier |
Baldwin-Lomax -Granville |
Dornier IKARUS, and a boundary layer code (Horton, 1991) |
the Dornier N-S methods,and a boundary layer method |
|
Helsinki UT |
k-w, Menter k-w, Shear-Stress-Transport, Cebeci-Smith, k-ε / Chien |
FINFLO |
a 2D/3D finite volume N-S solver, an implicit pseudo-time integration |
|
IMFT |
k-ε / Chien, Jones-L, Lam-Bremhorst, L-Sharma, modified, two-layer |
Tzabiras et al(1986), Braza(1986)/Jin&Braza(1994) |
based on the principles of predictor-corrector pressure-schemes, either the SIMPLE algorithm or the predictor-corrector pressure schemes |
|
KTH |
Baldwin-Lomax, k-t (with Speziale & y+) |
NSMB (Navier-Stokes Multi Block) |
structured multi block grids, the finite volume method with a central difference, and an explicit four stage Runge-Kutta scheme |
|
ONERA |
k (half-eq’n) and k-u’v’ (2 half-eq’n) using adaptive meshing |
VIS07 |
Viscous-Inviscid-Solvers (VIS) |
|
Parallax |
k-ε / Chien |
centered differencing for diffusive fluxes, Bounded Skew Hybrid Differencing Scheme for convective fluxes, PISO(Pressure Implicit Split Operator) algorithm | |
|
SAAB |
k-ε / Shear-Stress-Transport |
Saab code NS2D |
a cell-centered finite volume approximation in space, an explicit five-step Runge-Kutta scheme in time |
|
TU Berlin |
Baldwin-Lomax, Cebeci-Smith, Johnson-King, k-ε / LLYap, k-w Menter, k-w Wilcox, k-w (own) |
Interactive Boundary-Layer (IBL), consisting of a variable direct/inverse boundary-layer procedure | |
|
TU Chemnitz |
Baldwin-Lomax, Cebeci-Smith, k-e Wolfshtein (with and without Johnstone blending) |
MUFLO |
a cell-centred, finite-volume method, an explicit time-stepping Runge-Kutta algorithm |
|
TU Denmark |
Baldwin-Lomax, Baldwin-Barth |
a central difference expressions for the Laplacians and either simple upwinding or a so-called plus/minus upwinding for the convective term, the ADI procedure of Peaceman-Rachford. | |
|
UMIST |
Lien-Leschziner, Non-Linear k-ε Shih+Wolfshtein, Gibson-L/Kraft-L, Gibson-L/Shir |
a general non-orthogonal, block-structured finite-volume scheme, advection is approximated by the UMIST scheme. |
A great variety of wall functions and wall-region treatments has also been employed in the previous studies, with mixed results, on the basis of which we are not in a position to
recommend one specific approach.
Boundary Conditions
Based on practices used in the ECARP project, we recommend the following for a compressible RANS calculation:
- At the airfoil boundary use adiabatic walls with a no-slip condition. Set the turbulence energy and normal derivative of dissipation to zero (or equivalent).
- At the far-field boundary, use absorbing / non-reflecting boundary conditions (1D Riemann invariants).
- At the inflow boundary, use Riemann invariants.
For an incompressible RANS calculation:
- Use no-slip conditions at the wall, with zero pressure gradient normal to the wall.
- Use second-order extrapolations at outflow boundary and elsewhere as required.
© copyright ERCOFTAC 2004
Contributors: Peter Voke - University of Surrey
