Evaluation AC3-10: Difference between revisions
No edit summary |
David.Fowler (talk | contribs) No edit summary |
||
| Line 1: | Line 1: | ||
{{AC|front=AC 3-10|description=Description_AC3-10|testdata=Test Data_AC3-10|cfdsimulations=CFD Simulations_AC3-10|evaluation=Evaluation_AC3-10|qualityreview=Quality Review_AC3-10|bestpractice=Best Practice Advice_AC3-10|relatedUFRs=Related UFRs_AC3-10}} | |||
='''Combining/dividing flow in Y junction'''= | ='''Combining/dividing flow in Y junction'''= | ||
| Line 147: | Line 149: | ||
Site Design and Implementation: [[Atkins]] and [[UniS]] | Site Design and Implementation: [[Atkins]] and [[UniS]] | ||
{{AC|front=AC 3-10|description=Description_AC3-10|testdata=Test Data_AC3-10|cfdsimulations=CFD Simulations_AC3-10|evaluation=Evaluation_AC3-10|qualityreview=Quality Review_AC3-10|bestpractice=Best Practice Advice_AC3-10|relatedUFRs=Related UFRs_AC3-10}} | |||
Revision as of 10:24, 19 March 2009
Combining/dividing flow in Y junction
Application Challenge 3-10 © copyright ERCOFTAC 2004
Comparison of Test data and CFD
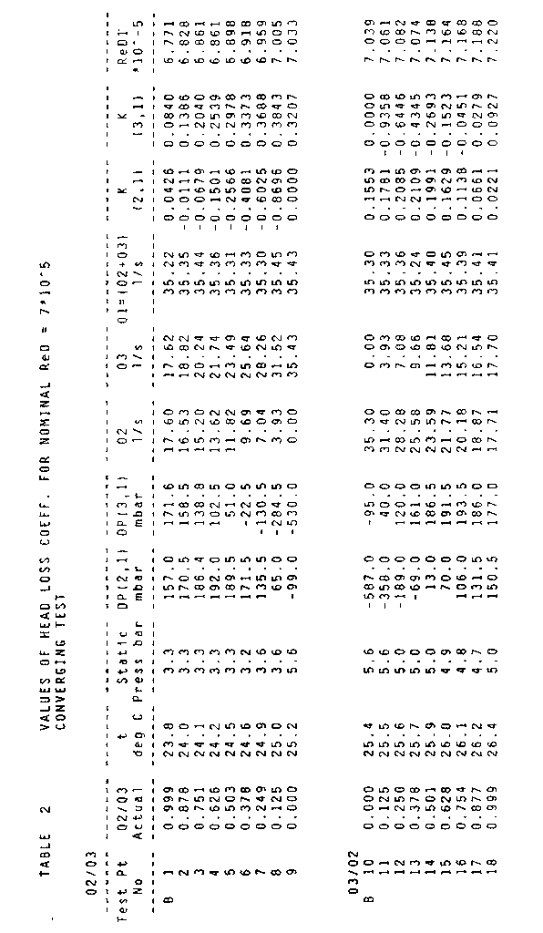
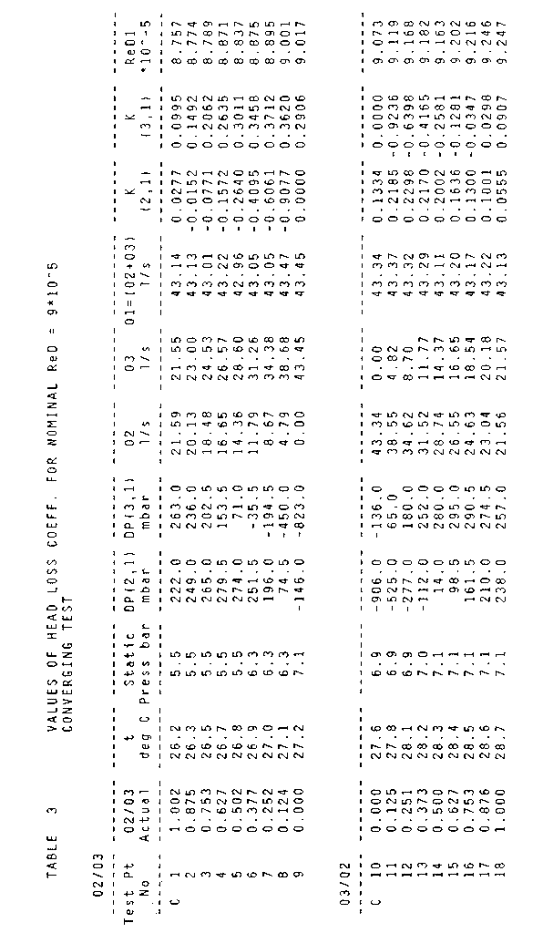
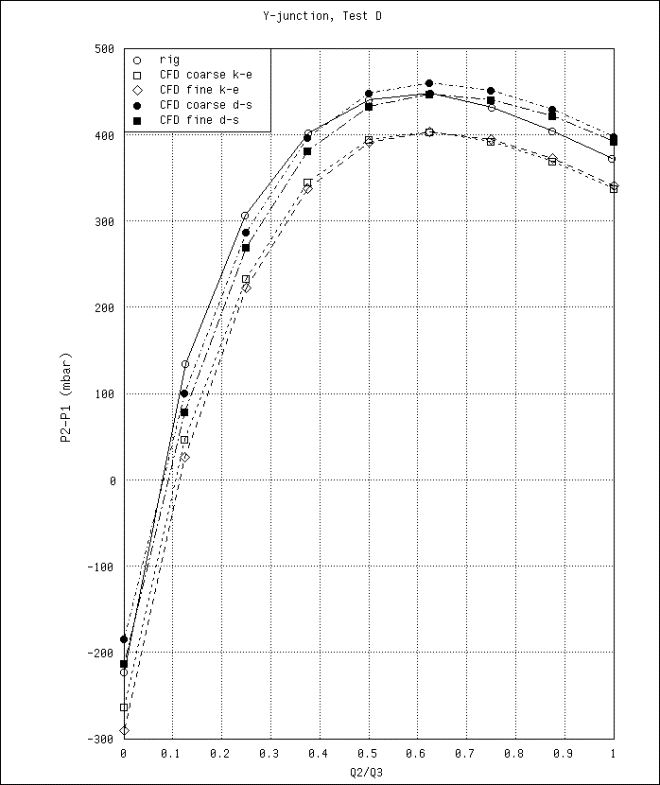
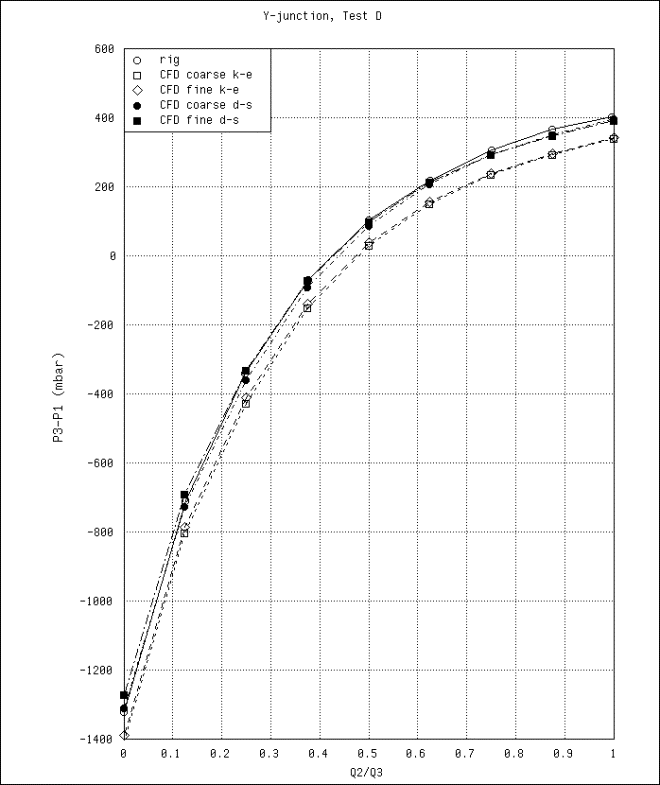
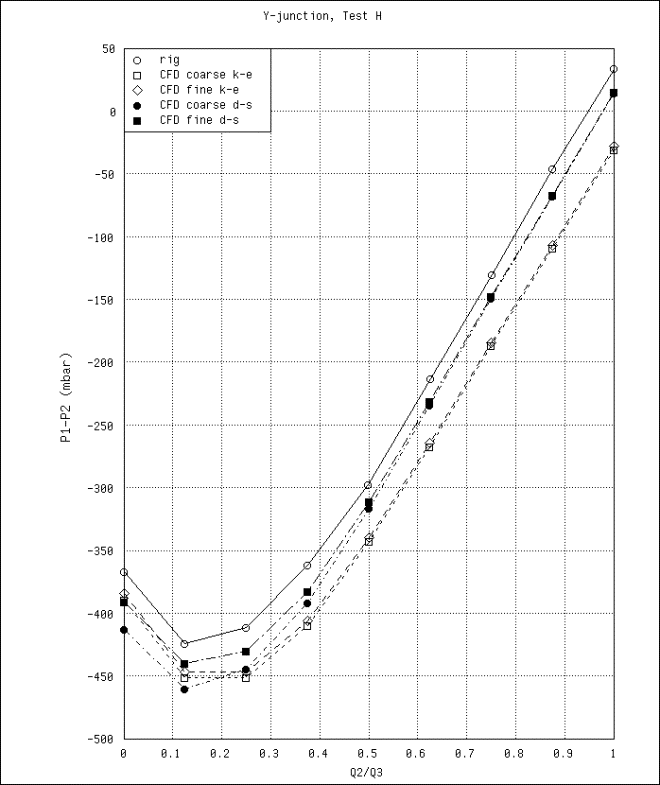
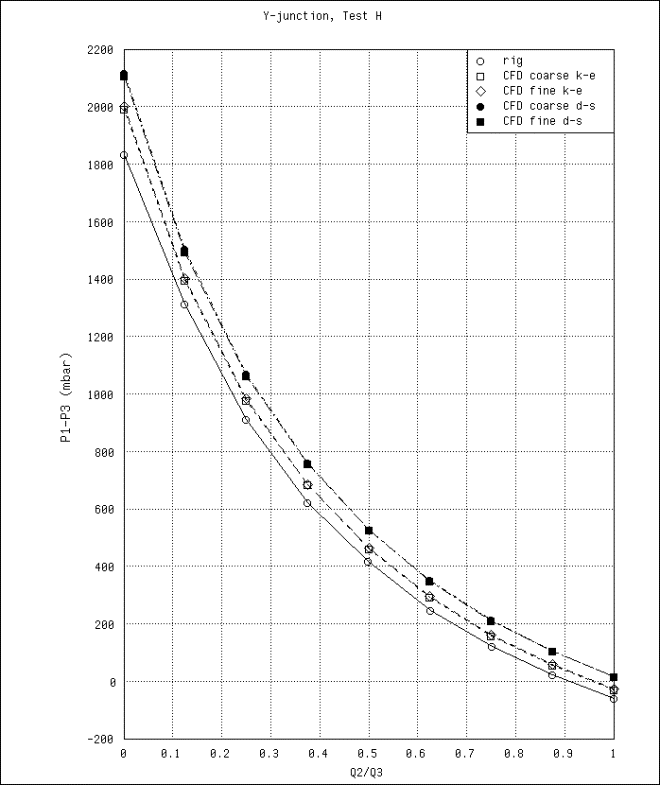
The CFD results have been used to calculate the pressure drops between the main branch (leg 1) and each of the two secondary branches (legs 2 and 3) for each case. These are compared with the experimental data in Figures 11 to 14. The following conclusions can be drawn:
• Both turbulence models predict the variation of pressure drop with flow split in the Y-junction reasonably well.
• Neither turbulence model shows much sensitivity to the near-wall mesh resolution.
• The ‘differential stress’ turbulence model generally gives better agreement with the experimental data.
Recommendations for future work
The following recommendations for future work are appropriate:
• Do further CFD calculations using finer grids.
• Perform further experiments to measure velocities and turbulence quantities within the Y-junction
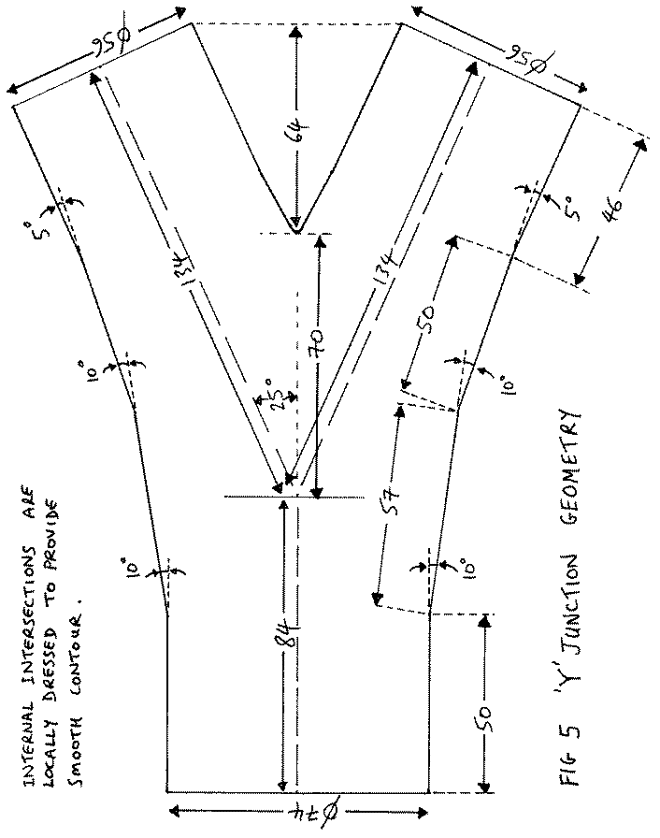
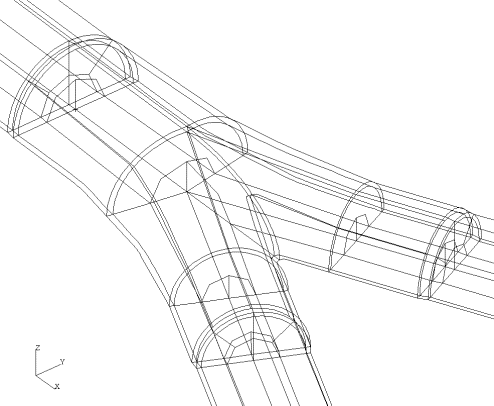
Figure 6 - Y-Junction Geometry & Block Structure
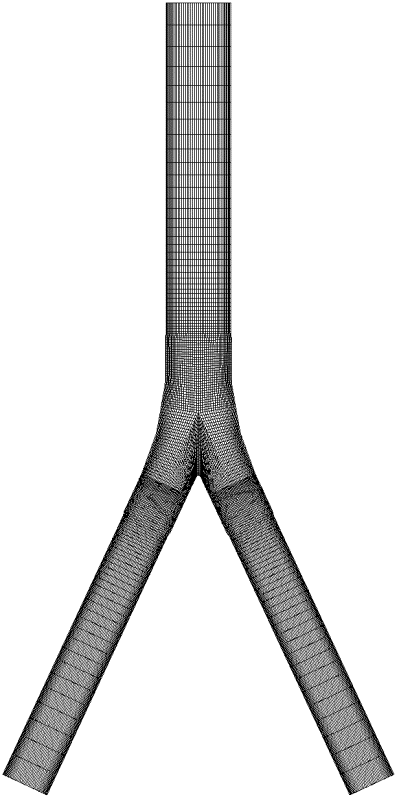
Figure 7 – Coarse mesh at z=0
Figure 8 – Coarse mesh at main branch inlet
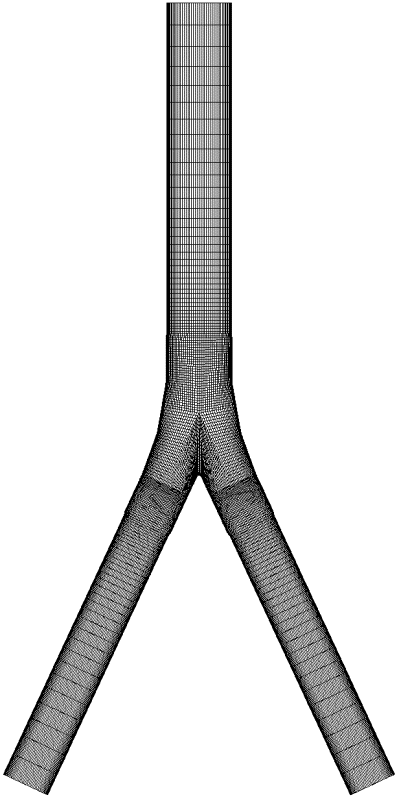
Figure 9 – Fine mesh at z=0
Figure 10 – Fine mesh at main branch inlet
Figure 11 Test D - Comparison of experimental data and CFX4 predictions
Figure 12 Test D – Comparison of experimental data and CFX4 predictions
Figure 13 Test H – Comparison of experimental data and CFX4 predictions
Figure 14 Test H – Comparison of experimental data and CFX4 predictions
© copyright ERCOFTAC 2004
Contributors: Alan Stevens - Rolls-Royce Marine Power, Engineering & Technology Division
Site Design and Implementation: Atkins and UniS

