Description AC6-06: Difference between revisions
No edit summary |
David.Fowler (talk | contribs) |
||
| Line 38: | Line 38: | ||
<math> | <math>\zeta = 1- \frac{1-\left(\frac{P_2}{P_{02}}\right)^\frac{\kappa -1}{\kappa}}{1-\left(\frac{P_2}{P_{01}}\right)^\frac{\kappa -1}{\kappa}}</math> | ||
| Line 48: | Line 48: | ||
Blade heat transfer coefficient distribution on blade profile is finally available to test the transition and turbulence model. The following expression can be used to compute heat transfer coefficient h from measured thermal flux, total inlet temperature and measured wall temperature. | Blade heat transfer coefficient distribution on blade profile is finally available to test the transition and turbulence model. The following expression can be used to compute heat transfer coefficient h from measured thermal flux, total inlet temperature and measured wall temperature. | ||
<math> | <math>h = \frac{\dot{q_w}}{T_{01} - T_w}</math> | ||
=='''Flow Domain Geometry'''== | =='''Flow Domain Geometry'''== | ||
Revision as of 14:32, 24 February 2009
Gas Turbine nozzle cascade
Application Challenge 6-06 © copyright ERCOFTAC 2004
Description
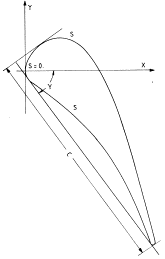
The experimental cascade rig here suggested was investigated in the Von Karman Institute Isentropic Light Piston Compression Tube facility (CT2). The facility (Fig 1) uses air as working fluid and is especially engineered to provide constant freestream conditions (total temperature, total pressure and mass flow), which can be varied respectively between 300 and 600 K and 0.5 and 7 bar. The downstream dump tank allows static pressure adjustment and thus the independent selection of Mach and Reynolds number. The test case is represented by the blade shown in Fig 1-b. This profile is the nozzle guide vane of a highly loaded transonic turbine, with a design isentropic mach number of 0.9 in the outlet section.
The whole cascade is linear and the instrumentation has been placed on the central blade for both pressure and heat transfer measurements.
Figure 1: Experimental Apparatus and Blade Geometry
Introduction
From the present experimental campaign blade velocity distributions, exit flow angles, free-stream turbulence intensity and spectrum and heat transfer coefficients measurements are available. These different measurements have been performed for different combinations of Mach and Reynolds number. The gas to wall temperature ratio compares to the values currently observed in modern application. A wide set of experimental data is available both for the blade aerodynamic performances and convective heat transfer.
The nominal isentropic Mach number in the outlet section is 0.9 while in the experimental grid the values ranged from 0.7 to 1.10. Transonic regions and recompression shocks can be placed on the SS with varying intensity with the working condition.
The turbulence levels can vary from 1.0 to 6% while the Re spans from 0.5 105.to2.0 105.. Both turbulence level and Re widely influence the boundary layers characteristics and thus have a strong impact on the heat transfer coefficient. The velocity distribution, exit flow angles and the effect of freestream turbulence intensity at different Reynolds and Mach numbers have been inestigated. The data set about velocity distribution and exit flow angles, available after the experimental campaign, can be used profitely to test the numerical codes capability to capture turbulence transition in the transonic region which is always one of the most challenging tasks. The presence of transictional flow field and shock-boundary layer interaction has a large impact on the heat transfer coefficient. The results can be used to assess and tune turbulence and transition models in order to get CFD codes able to forecast the transition onset of laminar boundary layer on different flow conditions.
Several CFD simulations have been performed for the LS89 data set. Most of the computations have been focused to verify the numerical scheme and the turbulence model capability in predicting transition and heat transfer. Applications reported in literature refer to a wide range of turbulence models ranging from simple algebraic closures to the one and two equation approaches with different transition correlation. Examples can be found in the work of Gehrer et. al. comparing the algebraic model used by Arnone and Pacciani, the one equation of Spalart and Allmaras and the two equation (low-Re k-e) of Biswas and Fukuyama. Different contributions have been presented in the works of Levbre and Arts, Migliorini and Michelassi. Recently Steelant and Dick refer to the same test case for the analysis of a quite sophisticated approach developed for laminar/turbulent transition modelling. Generally the comparison with experiments shows a reasonable agreement, but also reveals problems and the importance required by a realistic prediction of transition and turbulence.
Relevance to Industrial Sector
One of the most relevant outcomes of the present experimental program consists of heat transfer distribution along the NGV blade for different free-stream turbulence intensities and spectrum. Besides measurements are available for different combinations of Mach in the transonic region and Reynolds number spanning in the range of typical industrial turbine application. Reliable heat transfer data for high Reynolds transonic flow conditions represent a quite important aspect for modern turbine stages especially for development and analysis of cooling systems needed to allow safe operating conditions of the blades and increase the overall performances of the engine. A good design from a thermal point of view might allow a higher inlet temperature, less cooling or a lighter design. Methods to predict the heat load in the design phase of the turbine are for this reason very valuable engineering tools. In this regard a reliable CFD code represent a very attractive approach for the projection phase thanks to the lower costs and relatively shorter response time in comparison to the experimental testing. But the validation of the CFD code requires important features like numerical accuracy, grid flexibility and validated turbulence and transition modelling, aspects which altogether heavily impact on the numerical forecast of heat transfer coefficient. The high Reynolds number, the transonic conditions and the wide range of free-stream turbulence make of this test case a realistic and demanding application for the performances of a numerical solver. In this regard a quite important aspect resulting from the comparison against experiments lays in the turbulence model capability of predicting the correct onset for the laminar-turbulent transition. In fact transition onset can be clearly detected for different free-stream turbulence levels, simply observing the experimental heat transfer coefficient distribution on the blade suction side.
Design or Assessment Parameters
The experimental data available were originally designed for convective heat transfer but are very attractive also for the validation of CFD code capability to capture the aerodynamic blade performance in different Mach and Reynolds flow condition and both viscous and unviscous methods. The parameters relevant in this regard are represented firstly by global parameters such as efficiency, mass flow rate and blade load as a function of Mach number.
Global efficiency can be computed and compared with experimental for different Reynolds number as a function of the isentropic Mach number. The following relationship can be used to compute efficiency, in which P2 and P02 are the mass averaged value of static and total pressure in the outlet section.The accuracy and grid sensitivity of CFD codes to capture aerodynamic effects both for viscid and unviscous flow regimes can be assessed comparing experimental and numerical mass averaged flow angle in the exit plane. These data are available for different mach Numbers and Re.
Besides the isentropic Mach number distribution for different loading are available for pressure and suction side in order to focus attention on the accuracy of the simulation in specific areas of blade profiles, mainly leading edge stagnation point or TE wake.
Blade heat transfer coefficient distribution on blade profile is finally available to test the transition and turbulence model. The following expression can be used to compute heat transfer coefficient h from measured thermal flux, total inlet temperature and measured wall temperature.
Flow Domain Geometry
The test case is represented by an high pressure turbine nozzle guide vane expecially designed for the investigation of heat transfer testing at the VKI Institute. As already said the blade shape (see Fig. 1) was optimised for a downstream Mach number equal to 0.9 by means of a peculiar (inverse method developed at VKI.). The blade co-ordinates are listed in files BLADE_COOR_SS.dat and BLADE_COOR_PS.dat, where also the curvilinear abscissa on the blade profile is reported. The most important geometrical features of the cascade are listed below:
| Inlet Angle | 0.0 |
| Chord (c) | 67.647mm |
| Pitch | 57.5mm |
| Stagger Angle | 55 deg (from axial direction) |
| Leading Edge Radius | 0.061 (at stagnation point) |
| Trealing Edge | 0.0105 (at stagnation point) |
Table 1 Geometrical features of the Cascade
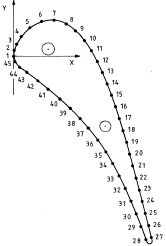
The blade was mounted on a linear cascade made of 5 profiles and four passages. The central blade was instrumented either for static pressure measurements or for heat flux measurements (blade convective heat transfer distribution). In Fig 2a-b the location of the static pressure taps and thin films for blade velocity distribution and heat transfer coefficient on the blade profile are shown.
Fig 2-a- Blade Geometry Fig 2-b- Press Taps Positions Fig 2-c Thin Film Positions
The exact position of the static pressure instrumentation is reported in files PRESSURE_MEASURE_TAPS.dat and PRESSURE_MEASURE_FILMS.dat.
Flow Physics and Fluid Dynamics Data
The flow conditions of the test programme are defined within the following limits:
T01 : 420 K
M2is : 0.5 105 ... 2.0 105
Tuinlet : 1.0 ... 6.0 %
The fluid involved is standard aria with the typical physical termo-fluid-dynamic behaviour (perfect gas with k=1.4, R=287 J/kgK). The relevant parameters can be represented by the classical not dimensional parameters(Reynolds, Mach, heat transfer coefficient) for turbine cascades .In particular the Reynolds number is based on the outlet isoentropic velocity.
The nominal isentropic Mach number in the outlet section is 0.9 and experiments have been performed for values ranging from 0.7 to 1.10, so transonic regions and recompression shocks are expected to develop on the SS of the blade as those reported by the Schlieren picture in Fig 4-a, referring to an isoentropic Mach of 1.03 and a Reynolds number of 2.0x10⁶. The intensity of this recompression shock strongly depends on the working condition.
The turbulence levels can vary from 1.0 to 6% and is generated by a grid of a spanwise oriented parallel bars (d=3mm; s/d =4). The intensity is varied by a displacement of the grid upstrem of the blade model. The boundary layer presents laminar and turbulent features depending on the location on the blade surface. On SS transition from laminar to turbulent flow takes place for higher values of freestream turbulence and Reynolds numbers.
The presence of transitional flow field and shock-boundary layer interaction has a large impact on the heat transfer coefficient and data available can represent an interesting tool in view both of a deeper understanding of the complex flow physics and the assessment and tuning of modern turbulence and transition models implemented in CFD codes. The reliable forecast of transition onset of laminar boundary layer and shock boundary layer interaction in different flow conditions constitutes an essential step toward the accurate prediction of the heat transfer behaviour.
The velocity distribution, exit flow angles and the effect of freestream turbulence intensity at different Reynolds and Mach numbers have been investigated. The data set about velocity distribution and exit flow angles, available after the experimental campaign, can be used profitely to test the numerical codes capability to capture turbulence transition in the transonic region which is always one of the most challenging tasks.
Fig 4 Schlieren Pitcure for M=1.03 and Re=2.0x10⁶
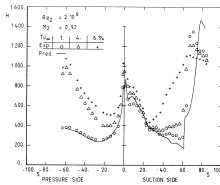
The influence of freestream turbulence Failed to parse (syntax error): {\displaystyle \[T_{u\infty}\]} on the heat transfer distribution has been investigated for different values of Re and Mach Numbers (Fig 5). At lower Reynolds numbers (Fig 5-a), the effect of freestream turbulence level is felt mainly in the laminar part of the boundary layer. The heat transfer coefficient reaches large values in the region of the leading edge and then rapidly decreases on either sides of the blade because of the development of a laminar boundary layer. The level of heating is slightly but distinctly increased by the Failed to parse (syntax error): {\displaystyle \[T_{u\infty}\]} level. For lowest Mach Numbers the position of the transition onset on the SS is not influenced by Failed to parse (syntax error): {\displaystyle \[T_{u\infty}\]} , while for the highest Mach numbers the transition clearly starts from the shock position (s=71 mm as shown in Fig 4-a). Along the pressure side surface the boundary is mostly in a laminar state.
Fig 5-a Heat Transfer Low Re Fig 5-b Heat Transfer Med Re Fig 5-a Heat Transfer High Re
Fig 5 - Effect of Freestream Turbulence Levels
Similar conclusions can be drawn for intermediate Reynolds number (Fig 5-b), while for the highest values of Reynolds numbers (Fig 5-c), the onset of transition is observed earlier along the SS especially for the lower Mach numbers. In this case the acceleration rate is not big enough to provoke the onset of transition. The behaviour of the boundary layer is different and on SS the onset of transition is strongly influenced by the velocity distribution. Transition is triggered by the first important decrease in velocity gradient. Along the PS the boundary layer is more sensitive to freestream Failed to parse (SVG with PNG fallback (MathML can be enabled via browser plugin): Invalid response ("Math extension cannot connect to Restbase.") from server "https://en.wikipedia.org/api/rest_v1/":): {\displaystyle \[T_{u\infty}\]} and a fully turbulent state is obtained for the highest Failed to parse (syntax error): {\displaystyle \[T_{u\infty}\]} levels
The influence of Re number on the boundary layers characteristics and heat transfer coefficient has also been investigated. The first effect of the Reynolds number is the increase of the overall level of heat flux mainly at low Failed to parse (syntax error): {\displaystyle \[T_{u\infty}\]} . The onset of transition on SS depends on the Reynolds number and moves towards the LE for the highest values.
© copyright ERCOFTAC 2004
Contributors: Elisabetta Belardini - Universita di Firenze
Site Design and Implementation: Atkins and UniS
Top Next


