AC 6-08 Evaluation: Difference between revisions
David.Fowler (talk | contribs) (New page: {{AC|front=AC 6-08|description=AC 6-08 Description|testdata=AC 6-08 Test Data|cfdsimulations=AC 6-08 CFD Simulations|evaluation=AC 6-08 Evaluation|qualityreview=AC 6-08 Quality Review|bes...) |
David.Fowler (talk | contribs) No edit summary |
||
| Line 1: | Line 1: | ||
{{AC|front=AC 6-08|description=AC 6-08 Description|testdata=AC 6-08 Test Data|cfdsimulations=AC 6-08 CFD Simulations|evaluation=AC 6-08 Evaluation|qualityreview=AC 6-08 Quality Review|bestpractice=AC 6-08 Best Practice Advice|relatedUFRs=AC 6-08 Related ACs}} | |||
{{AC|front=AC 6-08|description=AC 6-08 Description|testdata=AC 6-08 Test Data|cfdsimulations=AC 6-08 CFD Simulations|evaluation=AC 6-08 Evaluation|qualityreview=AC 6-08 Quality Review|bestpractice=AC 6-08 Best Practice Advice| | |||
| Line 141: | Line 140: | ||
{{AC|front=AC 6-08|description=AC 6-08 Description|testdata=AC 6-08 Test Data|cfdsimulations=AC 6-08 CFD Simulations|evaluation=AC 6-08 Evaluation|qualityreview=AC 6-08 Quality Review|bestpractice=AC 6-08 Best Practice Advice| | {{AC|front=AC 6-08|description=AC 6-08 Description|testdata=AC 6-08 Test Data|cfdsimulations=AC 6-08 CFD Simulations|evaluation=AC 6-08 Evaluation|qualityreview=AC 6-08 Quality Review|bestpractice=AC 6-08 Best Practice Advice|relatedUFRs=AC 6-08 Related ACs}} | ||
[[Category:Application Challenge]] | [[Category:Application Challenge]] | ||
Revision as of 15:39, 13 March 2009
High speed centrifugal compressor
Application Challenge 6-08 © copyright ERCOFTAC 2004
Evaluation
Comparison of Test data and CFD
On the basis of the stage efficiency and stage total pressure rise CFD1 was found to give the best agreement with the experimental data. Therefore, CFD1 was chosen for the detailed comparison of the flow field with the L2F measurements. The L2F measurements were carried out for the design point at mred=2.55kg/s. As mentioned in 3.2.6, the neglect of the fillets at the hub leads to an increase in massflow in the simulation due to the increased cross section area. To get the same flow field as in the experiments, an operating point with the same mred/mred,choke has therefore to be chosen for the comparison.
The files with the measurements can be found in Table EXP-B, the graphical comparisons between measurements and CFD1 in Table CFD-C.
|
|
|
|
|
|
Plane -1 |
|||
|
Plane 4 |
|||
|
Plane 8 |
|||
|
Plane 10 |
|||
|
90% span |
|||
Table CFD-C Comparison of flow field
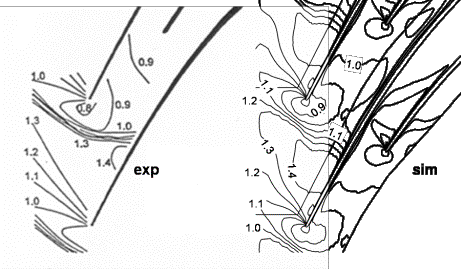
Fig. 4.1 Iso-Mach-lines at plane -1 (L2f_11.png)
Figures 4.1 - 4.4 show that the main flow structure is captured. The Mach number distribution right in front of the leading edge of the main blade (plane -1) is presented in Fig. 4.1, the Mach number distribution at 90% span in Fig. 4.2. The shock position in the simulation is quite similar to the experimental result. However, the shock-front is smeared in the simulation (Figs. 4.1 and 4.2). Although the grid has about 350000 nodes it is obviously not fine enough to resolve the strong gradients. A refinement of the grid in this region would improve the result.
Fig. 4.2 Iso-Mach-lines at 90% span (L2f_sp90.png)
At plane 4 (40% of meridional length), a region of low kinetic energy is found by the measurements at the pressure side of the blades close to the casing, which is more developed in the left channel of the splitter blade than in the right channel. These regions are also found in the simulation, although the Mach number level is in general a bit lower.
Fig. 4.3 Iso-Mach-lines at plane 4 (L2f_41.png)
At 80% meridional length (plane 8) the regions of low kinetic energy have moved to the suction side, in the measurements as well as in the simulation. The measured strong gradients in Mach number (0.3 to 0.7) from hub to casing are confirmed by the simulation.
Fig. 4.4 Iso-Mach-lines at plane 8 (L2f_81.png)
The static pressure rise at shroud is very well predicted by the simulation in the impeller, while it is over-estimated in the diffuser.
Fig. 4.5 Circumferential averaged dimensionless static pressure at shroud
Disccussion Conclusion and Recommendations
The present report describes the analysis of a high speed centrifugal compressor using CFD results. The computational results are compared to experimental data. The flow prediction is a complex task caused by the complex geometry of the centrifugal compressor and the strong interaction of the mean velocity levels with the predicted performance. In order to obtain computational results with an acceptable effort, the conditions for the CFD calculations are simplified in different ways:
• The computational domain is reduced to the region of interest. The inflow domain of the compressor including the impeller hub cone is included and the inflow is assumed to be axial. The outflow domain of the impeller is modeled as in the experiments as a radial vaneless diffuser.
• The circumferential computational domain is limited to a single rotating passage (including main blade and splitter blade flow), because the geometrical simplifications and the inflow conditions result in a periodic flow solution.
• A Frozen Rotor interface model is applied both at the inlet and the outlet of the impeller in order to allow the upstream and downstream regions to be computed as stationary steady state flows.
• The CFD calculations are limited to the flow conditions corresponding to the best-efficiency point.
• A single grid and a single turbulence model have been used.
• Sensitivity studies have been carried out taking into account the main application uncertainty, which is the absolute level of the running tip clearance between the rotating blades and the stationary casing.
The present study should be an example for a starting point of similar analyses of this complex geometry. Based on the present results, further CFD analyses would be useful which would examine the following features:
• Simulations using different numerical schemes, turbulence models and grid density. In particular the grid used in these simulations has not cleanly captured the shock at the blade inlet.
• Operating points at different points on the characteristic curve should be compared with the LDA flow data for the respective operating points.
© copyright ERCOFTAC 2004
Contributors: Beat Ribi; Frank Sieverding - MAN Turbomaschinen AG Schweiz; Sulzer Innotec AG


