UFR 4-03 Evaluation
Pipe flow - rotating
Underlying Flow Regime 4-03 © copyright ERCOFTAC 2004
Evaluation
Comparison of CFD calculations with Experiments
|
N |
H(pres) |
|
|||||
|
0 |
1.637 |
|
1.306 |
1.270 |
1. |
1. |
1. |
|
0.5 |
1.747 |
|
1.440 |
1.350 |
0.8386 |
0.9230 |
0.8523 |
|
1 |
1.771 |
|
1.503 |
1.457 |
0.8290 |
0.7692 |
0.7035 |
|
2 |
1.913 |
|
1.660 |
1.689 |
0.8247 |
0.6670 |
0.5898 |
Table 1 values of the global quantities in the present simulation indicated by (pres Re=5000),in the experiment by Reich & Beer (1989) (RB Re=5000), in that by Murakami & Kikuyama (1987) (MK Re=10000) and in that by Nikuyama et al (1983) (KM Re=7500)
In Tab.1 the results of Reich & Beer (1989) at Re=5000, those by Nishibori et al. (1987) at Re=10000 and those by Kikuyama et al. (1983) at Re=7500 and at ![]() are compared with the DNS by Orlandi & Fatica (1997). The shape factor H is defined as
are compared with the DNS by Orlandi & Fatica (1997). The shape factor H is defined as ![]()
In Tab.1 H and ![]() obtained by the DNS agree satisfactorily well with the experiments. On the contrary the wall friction
obtained by the DNS agree satisfactorily well with the experiments. On the contrary the wall friction ![]() reduction in the simulations is lower than that in the experiments, showing a negligible dependence on N for N>0.5.
reduction in the simulations is lower than that in the experiments, showing a negligible dependence on N for N>0.5.
The lower Re number of the simulations could be a cause of this difference since the experiments by Kikuyama et al. (1983) show a reduced dependence of the friction coefficients when the Reynolds number decreases. However, the Reich & Beer (1989) experiment was at the same Reynolds number thus a further reason for the difference could be the influence of the inlet conditions on the measurements. This is a more plausible reason because Murakami & Kikuyama (1980) showed that the loss coefficient depends on the axial location of the measurements. Perhaps ![]() , the distance where Reich & Beer (1989) took the measurements, is still not sufficient to achieve the condition of fully developed rotating pipe. In addition it should be considered that the direct simulations are performed at constant mass flow rate
, the distance where Reich & Beer (1989) took the measurements, is still not sufficient to achieve the condition of fully developed rotating pipe. In addition it should be considered that the direct simulations are performed at constant mass flow rate ![]() ; in the experiment, on the other hand, usually the head of the pump is kept constant thus the flow conditions are different and this could produce effects on the friction coefficients.
; in the experiment, on the other hand, usually the head of the pump is kept constant thus the flow conditions are different and this could produce effects on the friction coefficients.
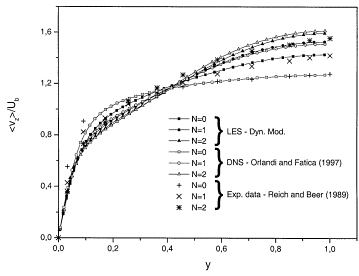
In Figure 3 is plotted the axial mean velocity profile versus the wall distance for various rotation numbers (N=0,1,2). When the pipe is rotating the streamwise velocity increases near the centre and decreases near the wall. The computational mean velocity profile gradually approaches Poiseuille profile due to the stabilizing effect of the centrifugal force. There is a good agreement between the experiment by Reich and Beer (1989), the DNS by Orlandi & Fatica (1997) and the LES by Feiz et al. (2003). The axial velocity profiles, scaled with the bulk velocity, assume at ![]() in Orlandi & Fatica (1997) is about
in Orlandi & Fatica (1997) is about ![]() . A similar behaviour was observed in the experiments by Reich & Beer (1989) and in the simulation by EBN. The value of
. A similar behaviour was observed in the experiments by Reich & Beer (1989) and in the simulation by EBN. The value of ![]() found by Orlandi & Fatica (1997) agrees with the value found by Kikuyama et al. (1983) (
found by Orlandi & Fatica (1997) agrees with the value found by Kikuyama et al. (1983) (![]() ) and differs from
) and differs from ![]() and
and ![]() found respectively by Reich & Beer (1989) and by EBN. Figure 3 shows that the variation with N of the numerical simulations are in qualitative agreement with those measured by Reich & Beer (1989). A better agreement is obtained by scaling the experimental profiles at N>0 with the ratio between the centreline velocity of the experiment and of the simulation at N=0. Since the Reynolds number is the same the reason for the difference between the profiles, at N=0, of the numerical simulation and of Reich & Beer (1989) should be the effect of the entrance conditions in the experiment.
found respectively by Reich & Beer (1989) and by EBN. Figure 3 shows that the variation with N of the numerical simulations are in qualitative agreement with those measured by Reich & Beer (1989). A better agreement is obtained by scaling the experimental profiles at N>0 with the ratio between the centreline velocity of the experiment and of the simulation at N=0. Since the Reynolds number is the same the reason for the difference between the profiles, at N=0, of the numerical simulation and of Reich & Beer (1989) should be the effect of the entrance conditions in the experiment.
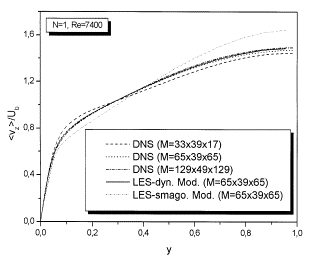
The results of the Large Eddy Simulation in Figure 4 have been obtained with the dynamic model. This, indeed, has been shown to reproduce the results of DNS more accurately (Figure 4). The axial velocities using LES wit Smagorinsky model and the simulation without subgrid-scale model are in less agreement with the DNS. The reason of this discrepancy may be the choice of the value of the constant ![]() (here 0.15). One of the problems with the Smagorinsky model is that the appropriate value of the coefficient
(here 0.15). One of the problems with the Smagorinsky model is that the appropriate value of the coefficient ![]() is different in different flow regimes. In particular, it is zero in laminar flows, and it is attenuated near the walls compared with its value (0.15) in high Reynolds number free turbulent flows. Indeed the model works well for the isotropic turbulence. For inhomogeneous flows the Smagorinsky model is too dissipative (it transfers too much energy to the residual motion Pope 2000).
is different in different flow regimes. In particular, it is zero in laminar flows, and it is attenuated near the walls compared with its value (0.15) in high Reynolds number free turbulent flows. Indeed the model works well for the isotropic turbulence. For inhomogeneous flows the Smagorinsky model is too dissipative (it transfers too much energy to the residual motion Pope 2000).
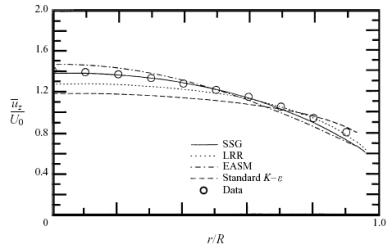
In Figure 5, the predictions of several two-equation models for the axial mean velocity in an axially rotating pipe are displayed for a non-dimensional rotation rate of N= 0:5 and compared with the experimental data of Imao et al. (1996) as well as with the predictions of several second-order closures. It is clear from these calculations that, consistent with the results derived in this paper, the ![]() model does not respond to the rotation, incorrectly yielding a mean velocity that is independent of the rotation rate of the pipe (the nonlinear
model does not respond to the rotation, incorrectly yielding a mean velocity that is independent of the rotation rate of the pipe (the nonlinear ![]() model yields similar results which are not shown for simplicity). On the other hand, the two-dimensional explicit algebraic stress model based on the SSG model (Gatski & Speziale 1993) responds to the rotation and predicts a reasonably good axial mean velocity in agreement with experiments as shown in Figure 5. However, all of these two-equation models predict that the mean swirl velocity
model yields similar results which are not shown for simplicity). On the other hand, the two-dimensional explicit algebraic stress model based on the SSG model (Gatski & Speziale 1993) responds to the rotation and predicts a reasonably good axial mean velocity in agreement with experiments as shown in Figure 5. However, all of these two-equation models predict that the mean swirl velocity ![]() is zero relative to the rotating pipe. Although the two-dimensional explicit algebraic stress model does not predict the presence of a mean swirl velocity relative to the rotating pipe, it is not that serious from an engineering standpoint. This mean swirl velocity only constitutes approximately a 15% effect, relative to the axial mean velocity.
is zero relative to the rotating pipe. Although the two-dimensional explicit algebraic stress model does not predict the presence of a mean swirl velocity relative to the rotating pipe, it is not that serious from an engineering standpoint. This mean swirl velocity only constitutes approximately a 15% effect, relative to the axial mean velocity.
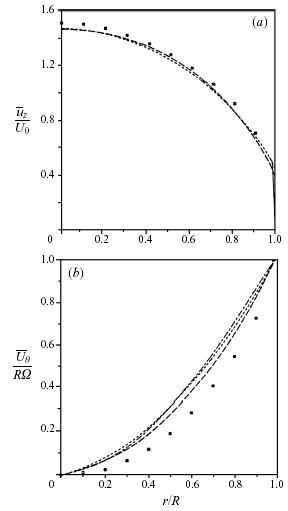
In Figure 6, it is shown that with a three-dimensional explicit algebraic stress model it is possible to predict the presence of a mean swirl velocity along with a rotationally dependent axial mean velocity. For this purpose, calculations are taken from Wallin & Johansson (1997) where comparisons were made with the experimental data of Imao et al. (1996).
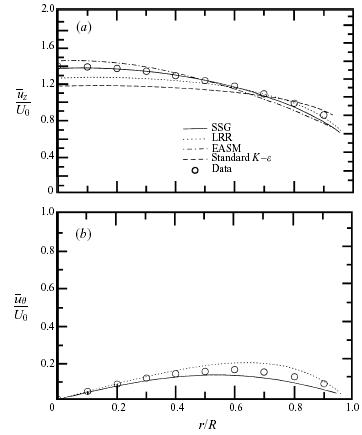
The results obtained for the axial mean velocity and mean swirl velocity, relative to the rotating pipe, obtained from second-order closures are displayed in Figure 7 side by side for the axially rotating pipe (N = 0:5). It is clear from the results for the mean velocity that the Launder et al. model is able to predict both mean effects reasonably well in an axially rotating pipe while the SSG model yields results that are even better. It should be remembered that second-order closures are equivalent to an algebraic model with a quartic nonlinearity when the algebraic stress model approximation is made in three dimensions (Gatski & Speziale 1993). This explains why both three-dimensional explicit algebraic stress models and second-order closure models do well.
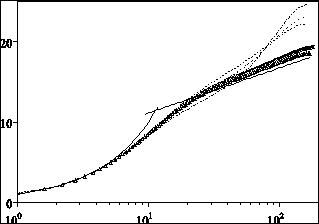
In Figure 8 the mean velocity profiles, in wall units, obtained with the DNS by Orlandi & Fatica (1997), show the drag reduction through the upward shifting of the log law. As usual, ![]() indicates the distance from the wall in wall units, in the pipe it is defined as
indicates the distance from the wall in wall units, in the pipe it is defined as ![]() . While at N<1 the size of the buffer region remains unchanged at N=2 the buffer region almost completely disappears and a first log region starts just after the viscous region. It corresponds to the region where the turbulent energy is constant.
. While at N<1 the size of the buffer region remains unchanged at N=2 the buffer region almost completely disappears and a first log region starts just after the viscous region. It corresponds to the region where the turbulent energy is constant.
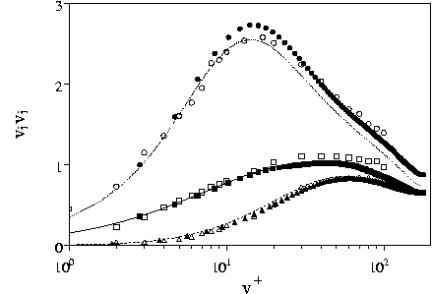
Orlandi & Fatica (1997) before analysing the rotating cases, tested the numerical method for a non-rotating pipe. The rms agrees closely with those of Eggels et al. (1994) and with those of Durst Jovanovic & Sender (1995) (Figure 9).
Figure 10 Root Mean Square profiles of azimuthal, radial and axial velocity for N=1 (left) and of axial velocity for varius N (right) , (From Feiz et al. 2003 copyright International Journal of Heat and Fluid).
Figure 10 illustrates the rms velocity profiles for N=1 in the LES by Feiz et al. (2003) and in the DNS by Orlandi & Fatica (1997). It can be observed that the rotation of the wall has large effects on the rms, these being more pronounced for streamwise rms velocity. Similar observations have been reported by Eggels et al. (1994). The fluctuating velocity components with both subgrid scale models are quite close to the DNS. However, the numerical results, obtained using the dynamic model, are slightly better. The streamwise rms velocity of Feiz et al. (2003) and of Orlandi & Fatica (1997) is shown for various rotation numbers N (Figure 10b). Near the wall, the peak is reduced when N increases. For N=1 and 2, the distributions tend to have the same values. Orlandi & Fatica (1997) claimed that this is a tendency towards isotropization of turbulence when the rotation rate increases. For all the rotational rates the dynamic model gives results closer to DNS.
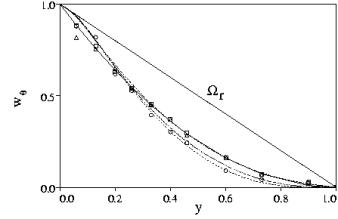
Figure 11 Radial velocity in the laboratory reference frame ![]() N=0.5,
N=0.5, ![]() N=1.0,
N=1.0, ![]() N=2.0,
N=2.0, ![]() theoretical
theoretical ![]() ○ N=0.5, ▲ N=1, □ N=2 symbols experiment by Kikuyama et al. (1983), (from Orlandi & Fatica 1997 copyright J. Fluid Mech.).
○ N=0.5, ▲ N=1, □ N=2 symbols experiment by Kikuyama et al. (1983), (from Orlandi & Fatica 1997 copyright J. Fluid Mech.).
When ![]() is scaled with the wall rotational velocity
is scaled with the wall rotational velocity ![]() Reich & Beer (1989) claimed that it is independent of N and of Re. The same outcome was found by Kikuyama et al. (1983) in their large number of experiments. In the DNS by Orlandi & Fatica (1997), performed in the rotating frame, to have the same scaling as in the experiment the linear solid body rotation velocity
Reich & Beer (1989) claimed that it is independent of N and of Re. The same outcome was found by Kikuyama et al. (1983) in their large number of experiments. In the DNS by Orlandi & Fatica (1997), performed in the rotating frame, to have the same scaling as in the experiment the linear solid body rotation velocity ![]() must be added to
must be added to ![]() . Moreover, the dimensional
. Moreover, the dimensional ![]() should be scaled with the centre line velocity. By this operation the profiles of
should be scaled with the centre line velocity. By this operation the profiles of ![]() (Figure 11) show a slight dependence on N. In Figure 11 there are also the values by Kikuyama at Re=10000 reported in the paper by Hirai et al. (1988). In the original paper by Kikuyama et al. (1983) it was difficult to read the data, and those at N=0.5 were given only for few radial locations. A very careful observation of the data at N=0.5, however, shows that the symbols do not exactly coincide with those at N=1. The values of Reich & Beer (1989) were not reported since these coincided exactly with the theoretical curve
(Figure 11) show a slight dependence on N. In Figure 11 there are also the values by Kikuyama at Re=10000 reported in the paper by Hirai et al. (1988). In the original paper by Kikuyama et al. (1983) it was difficult to read the data, and those at N=0.5 were given only for few radial locations. A very careful observation of the data at N=0.5, however, shows that the symbols do not exactly coincide with those at N=1. The values of Reich & Beer (1989) were not reported since these coincided exactly with the theoretical curve ![]()
The profiles of ![]() by Orlandi & Fatica (1997) do not collapse on a single curve, as in Reich & Beer (1989), however they are in a good agreement with Kikuyamas data. Also EBN in the direct simulation, for two values of N, found a not perfect collapse of the profiles. On the contrary, the EBN profiles collapsed in the higher Reynolds number LES simulations at N=0.71. From these considerations we could conjecture that the discrepancies with the experimental results of Reich & Beer (1989) could be due, once more, to the effects of the entrance condition and not to Re, since in the experiments the independence of Re was found.
by Orlandi & Fatica (1997) do not collapse on a single curve, as in Reich & Beer (1989), however they are in a good agreement with Kikuyamas data. Also EBN in the direct simulation, for two values of N, found a not perfect collapse of the profiles. On the contrary, the EBN profiles collapsed in the higher Reynolds number LES simulations at N=0.71. From these considerations we could conjecture that the discrepancies with the experimental results of Reich & Beer (1989) could be due, once more, to the effects of the entrance condition and not to Re, since in the experiments the independence of Re was found.
We checked that the lack of similarity, in Fig.3 did not depend on the insufficient time integration to reach the steady state. Moreover the averages were done with fields at ![]() constant. The independence of the radial resolution was also investigated, simulations with 49 and 97 points in the radial directions produced the same
constant. The independence of the radial resolution was also investigated, simulations with 49 and 97 points in the radial directions produced the same ![]() profiles. The check that our
profiles. The check that our ![]() at the steady state satisfies the relationship
at the steady state satisfies the relationship ![]() confirmed the assertion in EBN, that near the wall the
confirmed the assertion in EBN, that near the wall the ![]() profile must go to zero with a zero slope. Eq.(5) shows that if the theoretical relationship
profile must go to zero with a zero slope. Eq.(5) shows that if the theoretical relationship ![]() holds even close to the wall,
holds even close to the wall, ![]() is different from zero at the wall.
is different from zero at the wall.
The Kikuyama measurements at N=0.5 show for y<0.2 a tendency towards the linear profile, even if the measurement point closest to the wall is on the theoretical curve. Our believe is that the measurements near the wall are difficult when the wall rotates, as it is confirmed by some inconsistency of the data which does not appear in the central region. Inside the channel at N=0.5 the data of Kikuyama and the present ones do not coincide with the theoretical curve. By increasing N our results smoothly approach the theoretical curve while the Kikuyama data at N=1 and N=2 lie on the theoretical curve. The smooth increase of ![]() with N of the numerical simulation can be explained as a viscous correction that is greater as smaller is N.
with N of the numerical simulation can be explained as a viscous correction that is greater as smaller is N.
6.1 ACCURACY CHECK
Finite-differences permit in a very simple way to handle free-slip and no-slip boundary conditions and thus to verify whether the non-uniform spacing maintains the energy conservation in the in-viscid limit. This check was done by performing a coarse simulation (65 39 33) for ![]() and with a free-slip boundary. The calculation was started from a viscous unresolved simulation at Re=4900, corresponding to
and with a free-slip boundary. The calculation was started from a viscous unresolved simulation at Re=4900, corresponding to ![]() , and it was let free to evolve to a statistical steady state. In this case, the mean pressure gradient drops to zero and the mean axial velocity profile tends to be constant across the pipe.
, and it was let free to evolve to a statistical steady state. In this case, the mean pressure gradient drops to zero and the mean axial velocity profile tends to be constant across the pipe.
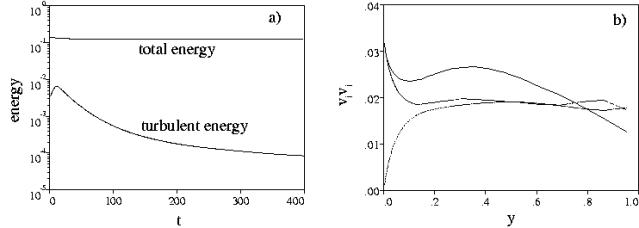
Figure 12a shows that the total energy remains constant and that the total turbulent energy decreases due to the reduction of turbulent energy production caused by the diminishing of the mean shear.
Figure 12b, in addition, shows that the radial profiles of each of the normal turbulent stresses reach the condition of almost isotropic turbulence within a large part of the pipe. The ![]() assumption is the cause of the anisotropy near the free-slip wall. This check proves that second order centred finite-differences, for the nonlinear terms, do not introduce any spurious numerical viscosity, which for positive values could lead to unphysical dissipation and for negative values to unphysical production of energy. The influence of aliasing errors for finite difference methods is not as important as for pseudo-spectral methods. Kravchenko & Moin (1996) have analyzed these errors for different schemes for the non-linear terms and they have shown that aliasing errors are negligible when staggered variables are used. We recall that, truncation and aliasing errors are very important for large eddy simulations but not for direct simulations, where all the significant scales must be resolved.
assumption is the cause of the anisotropy near the free-slip wall. This check proves that second order centred finite-differences, for the nonlinear terms, do not introduce any spurious numerical viscosity, which for positive values could lead to unphysical dissipation and for negative values to unphysical production of energy. The influence of aliasing errors for finite difference methods is not as important as for pseudo-spectral methods. Kravchenko & Moin (1996) have analyzed these errors for different schemes for the non-linear terms and they have shown that aliasing errors are negligible when staggered variables are used. We recall that, truncation and aliasing errors are very important for large eddy simulations but not for direct simulations, where all the significant scales must be resolved.
Figure 13 Mean axial velocity profiles in wall coordinates, (![]() log law), (
log law), (![]() 33 × 39 × 17), (
33 × 39 × 17), (![]() 65 × 39 × 33), (
65 × 39 × 33), (![]() 65 × 39 × 65), (▲ 129 × 49 × 129), (▼129 × 97 × 257) (× Eggels et al. 1994), (from Orlandi & Fatica 1997 copyright J. Fluid Mech.).
65 × 39 × 65), (▲ 129 × 49 × 129), (▼129 × 97 × 257) (× Eggels et al. 1994), (from Orlandi & Fatica 1997 copyright J. Fluid Mech.).
A test of the accuracy of the viscous terms discretization and of the entire numerical method was performed by a grid refinement check. In the non-rotating case this check was done, starting from a very coarse grid (32 38 16) and by doubling the number of points in the ![]() and
and ![]() directions until reaching the grid (128 96 128). A non-uniform grid in r with an enhanced clustering near the wall, located the first point at
directions until reaching the grid (128 96 128). A non-uniform grid in r with an enhanced clustering near the wall, located the first point at ![]() . The present results are compared with those by EUW, which were validated by comparison with PIV and LDA measurements and with the direct simulation of KMM in a plane channel.
. The present results are compared with those by EUW, which were validated by comparison with PIV and LDA measurements and with the direct simulation of KMM in a plane channel.
For all grids Figure 13a-b show that some sort of logarithmic profile is achieved, but the values of the von Karman constant are function of the resolution. In Figure 13a the full profile is shown, while in Figure 13b only the part within the buffer and the log regions is shown to emphasize the differences with the log law ![]() and with the numerical results by EUW.
and with the numerical results by EUW.
By <> we denote space averages in the two homogeneous directions z and ![]() and time averages every 10 time steps for a long physical time. The averaging time depends on the case studied, for N=0 the averages were performed for 200 time units, and this time was found to be sufficient. The 128 48 128 simulation, which uses fewer points than the EUW simulation, is in a very good agreement with their results. The good agreement is due to the non-uniform grid, which allows 48 points to be sufficient to locate the first point closer to the wall than the 96 equidistant points in EUW.
and time averages every 10 time steps for a long physical time. The averaging time depends on the case studied, for N=0 the averages were performed for 200 time units, and this time was found to be sufficient. The 128 48 128 simulation, which uses fewer points than the EUW simulation, is in a very good agreement with their results. The good agreement is due to the non-uniform grid, which allows 48 points to be sufficient to locate the first point closer to the wall than the 96 equidistant points in EUW.
From physical arguments the changes in the log law should be expected; the decrease of the number of points causes a worse resolution of the near-wall stream-wise vortices. Since these vortices are responsible for the turbulent wall friction, a decrease in their strength produces a drag reduction.
Figure 14 Second order turbulence statistics,(![]() 33 × 39 × 17), (
33 × 39 × 17), (![]() 65 × 39 × 33), (
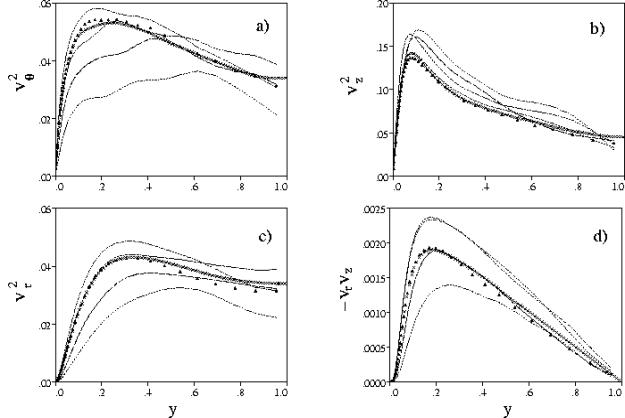
65 × 39 × 33), (![]() 65 × 39 × 65),(▲ 129 × 49 × 129),(129 × 97 × 257) × Eggels et al. 1994), (from Orlandi & Fatica 1997 copyright J. Fluid Mech.).
65 × 39 × 65),(▲ 129 × 49 × 129),(129 × 97 × 257) × Eggels et al. 1994), (from Orlandi & Fatica 1997 copyright J. Fluid Mech.).
This effect is reflected in Figure 14 by the rms profiles showing a decrease of the ![]() and
and ![]() , and an increase of the
, and an increase of the ![]() . The increase of the fluctuations in the stream-wise direction is due to a reduction on the mean velocity centreline. Figure 14a-d show that the refinement in
. The increase of the fluctuations in the stream-wise direction is due to a reduction on the mean velocity centreline. Figure 14a-d show that the refinement in ![]() has a greater influence than in z. The physical reason is that the better resolution of the azimuthal gradients of
has a greater influence than in z. The physical reason is that the better resolution of the azimuthal gradients of ![]() brings to a better description of the sweep and ejection events and hence to greater values of
brings to a better description of the sweep and ejection events and hence to greater values of ![]()
The observation that stream-wise vorticity produces the high- and low-speed streaks, and thus the turbulent wall friction was proposed by KMM based on observations made in the plane channel direct simulation, and was also proved by Orlandi & Jimenez (1994) by a two-dimensional model. The results in Figure 14 show that the refinement in the axial direction is less important, in fact the profiles by 128 48 64 and by 128 48 128 points do not largely differ from those by EUW by 128 96 256 points. In Figure 14d the Reynolds stress profiles of ![]() confirm that the coarsest simulation gives a sort of drag reduction. The reduction of
confirm that the coarsest simulation gives a sort of drag reduction. The reduction of ![]() is mainly due to a decrease of the
is mainly due to a decrease of the ![]() as in all situations in which a drag reduction is achieved. For the rotating case the check of the numerics was performed only at N=2. In the rotating case the check must be done not only on the resolution but also on the length of the computational domain in the stream-wise direction. In fact, if the length of the pipe was too short it could affect the long helical structures near the wall and at the centre of pipe. The near wall structures are smaller than those at the centre and then have shorter time scales. The statistical steady state is obtained with few fields near the wall, on the other hand it is necessary a larger number of fields to have satisfactory profiles in the central part. From these arguments it should be expected that the grid resolution and the pipe length should effect more the central than the wall region. We performed simulations on a pipe of length
as in all situations in which a drag reduction is achieved. For the rotating case the check of the numerics was performed only at N=2. In the rotating case the check must be done not only on the resolution but also on the length of the computational domain in the stream-wise direction. In fact, if the length of the pipe was too short it could affect the long helical structures near the wall and at the centre of pipe. The near wall structures are smaller than those at the centre and then have shorter time scales. The statistical steady state is obtained with few fields near the wall, on the other hand it is necessary a larger number of fields to have satisfactory profiles in the central part. From these arguments it should be expected that the grid resolution and the pipe length should effect more the central than the wall region. We performed simulations on a pipe of length ![]() by a grid 128 48 128 and 128 96 128 to check the radial resolution. Since a non-uniform grid was used this check is not so important, as it was shown for N=0. Two further simulations with
by a grid 128 48 128 and 128 96 128 to check the radial resolution. Since a non-uniform grid was used this check is not so important, as it was shown for N=0. Two further simulations with ![]() by 128 128 128 and 128 128 256 points were performed to investigate the effects of the length and the grid resolution in the stream-wise direction. From these simulations it was decided to use the simulation at N=2 by a grid 128 96 257 in a pipe of length
by 128 128 128 and 128 128 256 points were performed to investigate the effects of the length and the grid resolution in the stream-wise direction. From these simulations it was decided to use the simulation at N=2 by a grid 128 96 257 in a pipe of length ![]() to analyze the results. With 257 points in z, the resolution in wall units is
to analyze the results. With 257 points in z, the resolution in wall units is ![]() small enough to consider the present simulation as a fully direct simulation even in the central region.
small enough to consider the present simulation as a fully direct simulation even in the central region.
Figure 15 Second order turbulence statistics,(![]() 129 × 49 × 129
129 × 49 × 129 ![]() ), (
), (![]() 129 × 97 × 129
129 × 97 × 129 ![]() ), (
), (![]() 129 × 129 × 129
129 × 129 × 129 ![]() ), (
), (![]() 257 × 129 × 129
257 × 129 × 129 ![]() ), (
), (![]() 257 × 97 × 129
257 × 97 × 129 ![]() ), (from Orlandi & Fatica 1997 copyright J. Fluid Mech.).
), (from Orlandi & Fatica 1997 copyright J. Fluid Mech.).
Figure 15a-d show that when the pipe is rotating the length of the pipe is an important parameter in the direct simulations.
The final comment of the grid refinement checks is that very coarse calculations in 3D give acceptable results to reproduce some of the aspects of wall turbulent flows without introducing any sub-grid scale (s.g.s) model. Although a very coarse simulation without s.g.s. model could be more or less useful, from a physical point of view accurate LES simulations are always more necessaries.
However, since this numerical viscosity produces energy spectra decreasing reasonably well at high wave numbers, it is possible that these truncation errors affect the flow in the same manner as s.g.s. models do.
© copyright ERCOFTAC 2004
Contributors: Stefano Leonardi - Universita di Roma 'La Sapienza'
