UFR 2-05 Evaluation
Flow around airfoils (and blades) A-airfoil (Ma=0.15,
Re/m=2x106)
Underlying Flow Regime 2-05 © copyright ERCOFTAC 2004
Evaluation
Comparison of CFD calculations with Experiments
Here we shall only present a few of the most representative and suggestive of the many results emerging from the EUROVAL and ECARP projects. Figure 4 shows growth of the displacement thickness with x/c, suggesting that the Reynolds stress model used by CERFACS might be able to predict the boundary-layer growth better than simpler models used by other partners. Note, however, the starting point of the CERFACS RS curve, at about x/c=0.3, compared to other partners.
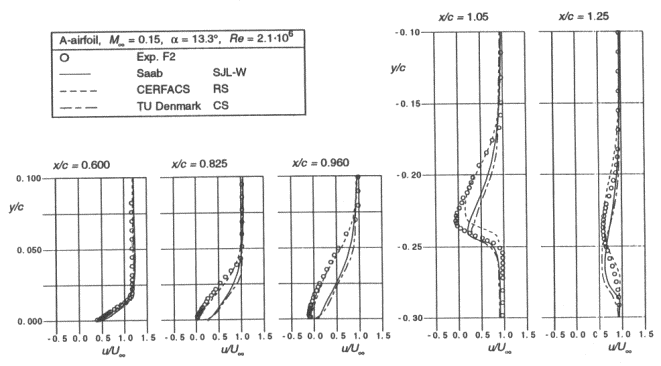
Figure 5 shows Cp distributions for the same contributors to EUROVAL and indicates that mis-prediction of the separation point affects the overall circulation round the airfoil and hence the shape of the leading-edge suction peak. Figure 6 shows some velocity profiles up to the separation point and beyond, showing again some prima facie evidence that the RS model is to be preferred. (The profiles in the wake, beyond the trailing edge, are of less immediate interest.)
Figure 5: Pressure distributions.

The conclusions of the ECARP study were broadly in line with those of EUROVAL. All standard eddy-viscosity models failed to predict separation in the F2 test case conditions. Even when the pressure distribution is more or less satisfactory, skin friction can be underestimated leading to too large a trailing-edge separation bubble. Predictive accuracy progressively improved as the level of modelling increased, but some doubt remains as there were more opportunities for specific modifications, leading to the suspicion that the improved predictions are a result of fine-tuning not based on well understood physical principles.
The contribution of ONERA to the ECARP results [2] is worthy of note, since they attempted to predict the transition point. (They pursued the same objective in the LESFOIL project [3] by resolving the laminar separation bubble near the leading edge, arguably with some success, though at great computational expense.) They used a “two half-equation” approach (k-u’v’) derived from Gibson-Launder, in combination with a VII method. The resulting transition point was upstream of the experimentally determined location, the skin friction was underestimated and the trailing separation bubble was too large. The conclusion was that “the ONERA results demonstrate that a transition effect can be larger that the effect of the turbulence model itself on the trailing edge separation bubble” [2].
The transition effect was subsequently looked at again by Lorentzen and Lindblad [11] and Jirásek et al. [4, 5]. They found that the models they were using (including a second-moment closure) barely predicted the transition, but moving the transition location upstream by 4% of chord (to between x/c=7% and 8%) yielded a definite improvement by most measures. This again suggests that the location of transition is more important than the model used. Worryingly, it also suggests that even knowing the location of transition in advance and fixing it in the right place is not enough, since the flow is critically sensitive to this flow feature.
Figure 8: Velocity profiles of Jirásek et al. [4] at x/c = 0.6, 0.9, 0.96, 0.99 for various models: solid, EARSM; dashed, SST; chain, BSL; dotted, EARSM with transition moved to 7% chord.
Conclusions
In general most single-moment closure models either predict no separation or a separation that is too weak. In turn, these predictions yield too high a circulation and too high a suction peak at the nose. Otherwise, the skin friction is predicted reasonably and parameters such as the displacement and momentum thickness are well estimated over the forward part of the airfoil, until near the trailing edge and the separation region. Second-moment closures appear to do better, algebraic stress models almost as well as Reynolds stress models.
Prediction or fixing of the transition point is one of the most important steps to predicting the separation position correctly. This in turn affects the circulation about the airfoil and hence other, apparently unconnected, features such as the shape of the leading edge suction peak. It is possible that fixing transition at 12% of chord (the position that transition occurred in the experiment) will lead to erroneous results, and equally possible that not fixing transition, so that the computation is turbulent from the leading edge, will give equally (or more) erroneous results. Nevertheless moving the fixed transition point upstream from 12% can improve the predictions.
Meshing the blunt trailing edge is critical, as a sharp trailing-edge airfoil (otherwise identical) has a very different separation which may reattach before the (sharp) trailing edge.
SUGGESTIONS FOR FUTURE WORK
There are a number of outstanding questions that need to be answered:
- Can all models predict the development and separation of the boundary layer correctly if the transition point is fixed in an appropriate way?
- Are any simple models capable of correctly predicting the transition point?
- Are second-moment closures really any better than simple models, once the transition is fixed?
- Are curvature terms important in predicting the boundary-layer development?
- Are stress terms (e.g. SST) useful for predicting the development?
- Does the extreme sensitivity of the flow make a genuinely grid-dependent solution impossible? If not, what resolution is really required for grid independence, and is the answer model-dependent?
© copyright ERCOFTAC 2004
Contributors: Peter Voke - University of Surrey


