UFR 4-09 Evaluation: Difference between revisions
| Line 37: | Line 37: | ||
''Interface height and temperature contrast'' | ''Interface height and temperature contrast'' | ||
Comparisons of the CFD results for interface height (defined as the level of minimum vertical motion outside the plume) and the reduced gravity of the stratification ''g<sup> | Comparisons of the CFD results for interface height (defined as the level of minimum vertical motion outside the plume) and the reduced gravity of the stratification ''g<sup>'</sup>''as a function of ''A''* are compared with the salt-bath experiments and theoretical model of Linden ''et al.'' (1990) in Figures 13 and 14. | ||
<center>[[Image:UFR4-09_Fig13a.gif|350px]] [[Image:UFR4-09_Fig13b.gif|350px]]</center> | <center>[[Image:UFR4-09_Fig13a.gif|350px]] [[Image:UFR4-09_Fig13b.gif|350px]]</center> | ||
Revision as of 07:28, 27 September 2011
Confined buoyant plume
Underlying Flow Regime 4-09 © copyright ERCOFTAC 2004
Evaluation
Comparison of CFD calculations with Experiments
Qualitative
Flow fields from the CFD runs for line-source and point-source plumes are shown in Figure 11 and Figure 12, respectively (compare Figure 5 for the salt bath experiments). The calculated flow fields are in good qualitative agreement with the results of the salt-bath experiments. In particular, there is a clear 2-layer stratification consisting of two relatively well-mixed layers. There is a jet-like flow from the inlet which impinges on the interface and causes some deflection. However, there appears to be little mixing at this location and the interface remains quite sharp. The principal mass transport pathway from the inlet to the upper layer is, therefore, a convoluted path through the lower layer and into the plume, as supposed in the theoretical model. The interface height was also found to be fairly insensitive to buoyancy flux (there was some small sensitivity in the 3D point-source case) in accord with the theoretical predictions.
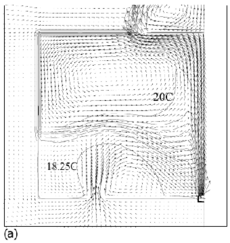
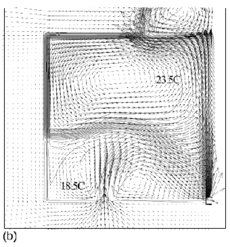
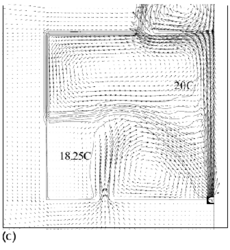
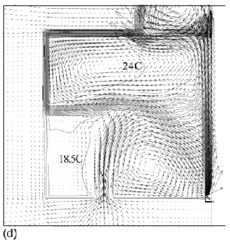
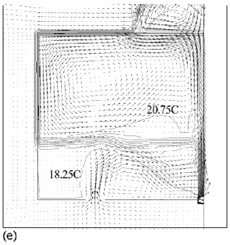
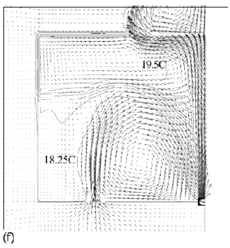
Figure 11. Calculated flow fields (temperature contours and velocity vectors) for 2D line-source plume simulations for (a) plume source heat input, Q = 200 W, effective vent size ![]() =0.148, 'standard' k–ε turbulence model; (b) Q = 1000 W,
=0.148, 'standard' k–ε turbulence model; (b) Q = 1000 W, ![]() =0.148, 'standard' k-ε turbulence model; (c) Q = 200 W,
=0.148, 'standard' k-ε turbulence model; (c) Q = 200 W, ![]() = 0.148, RNG k–ε turbulence model; (d) Q = 1000 W,
= 0.148, RNG k–ε turbulence model; (d) Q = 1000 W, ![]() = 0.148, RNG k–ε turbulence model; (e) Q = 200 W,
= 0.148, RNG k–ε turbulence model; (e) Q = 200 W, ![]() = 0.075, RNG k–ε turbulence model; (f) Q = 200 W,
= 0.075, RNG k–ε turbulence model; (f) Q = 200 W, ![]() =0.227, RNG k–ε turbulence model. Note that only half the room width is shown; the plume and symmetry plane are on the right-hand side of the region shown. (Cook & Lomas 1998)
Originals of all the figures in this UFR are in UFR4-09_Figures.pdf
=0.227, RNG k–ε turbulence model. Note that only half the room width is shown; the plume and symmetry plane are on the right-hand side of the region shown. (Cook & Lomas 1998)
Originals of all the figures in this UFR are in UFR4-09_Figures.pdf
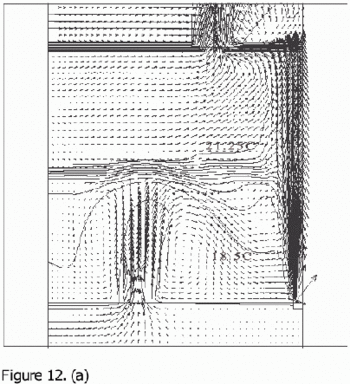
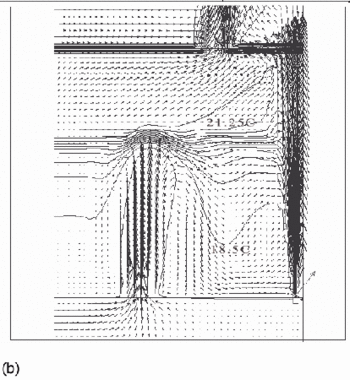
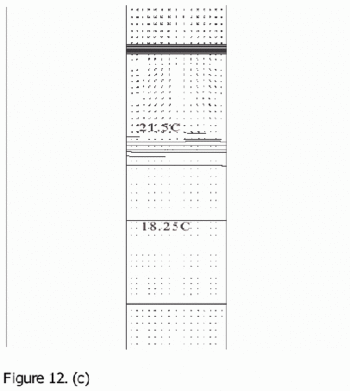
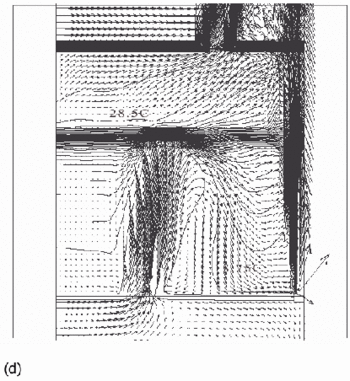
Figure 12. Calculated flow fields (temperature contours and velocity vectors) for 3D point-source plume simulations (Cook & Lomas 1997) for (a) plume source heat input, Q = 200 W, effective vent area ![]() =0.0304, 'standard' k-ε turbulence model; (b) Q = 200 W,
=0.0304, 'standard' k-ε turbulence model; (b) Q = 200 W, ![]() =0.0304, RNG k–ε turbulence model; (c) Q = 200 W,
=0.0304, RNG k–ε turbulence model; (c) Q = 200 W, ![]() RNG k–ε turbulence model, plane normal to room major-axis plane 0.2m from the wall; (d) Q = 1000 W,
RNG k–ε turbulence model, plane normal to room major-axis plane 0.2m from the wall; (d) Q = 1000 W, ![]() =0.0304, RNG k–ε turbulence model. Note that in a), b) and d), only half the room width is shown; the plume and symmetry plane are on the right-hand side of the region shown. (Cook & Lomas 1998)
Originals of all the figures in this UFR are in UFR4-09_Figures.pdf
=0.0304, RNG k–ε turbulence model. Note that in a), b) and d), only half the room width is shown; the plume and symmetry plane are on the right-hand side of the region shown. (Cook & Lomas 1998)
Originals of all the figures in this UFR are in UFR4-09_Figures.pdf
Quantitative
Interface height and temperature contrast
Comparisons of the CFD results for interface height (defined as the level of minimum vertical motion outside the plume) and the reduced gravity of the stratification g'as a function of A* are compared with the salt-bath experiments and theoretical model of Linden et al. (1990) in Figures 13 and 14.
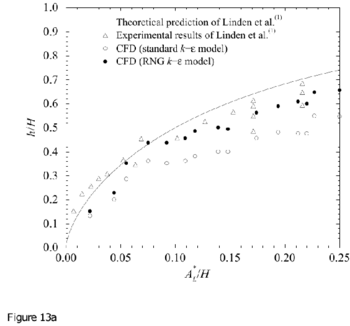
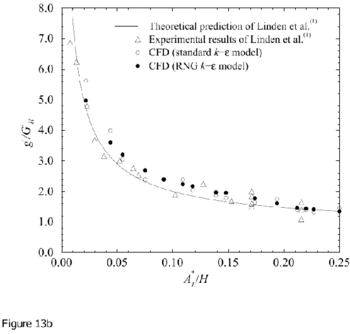
Figure 13. Measurements of a) interface height and b) reduced gravity for 2D line-source plumes, compared with the theoretical model and salt-bath experiments of Linden et al. (1990). In the theoretical curves the value of entrainment coefficient used is α = 0.1 has been used. Note that no-virtual origin corrections have been made and Ct = Cb = 1.0.) Originals of all the figures in this UFR are in UFR4-09_Figures.pdf
Generally good agreement is apparent between the CFD and salt-bath results. For both turbulence models, the non-dimensional interface height ![]() and stratification strength
and stratification strength ![]() show very similar variation with A* to that shown in the experimental data and predicted by the theory. For the 2D line-source experiments the agreement with the RNG results is better than for the "standard" k – ε model, whereas for the point-source experiments the agreement was less good.
show very similar variation with A* to that shown in the experimental data and predicted by the theory. For the 2D line-source experiments the agreement with the RNG results is better than for the "standard" k – ε model, whereas for the point-source experiments the agreement was less good.
Both the salt bath experiments and CFD simulations give lower values of interface height than predicted by the theory. Subsequent work has shown that there may be three reasons for this discrepancy.
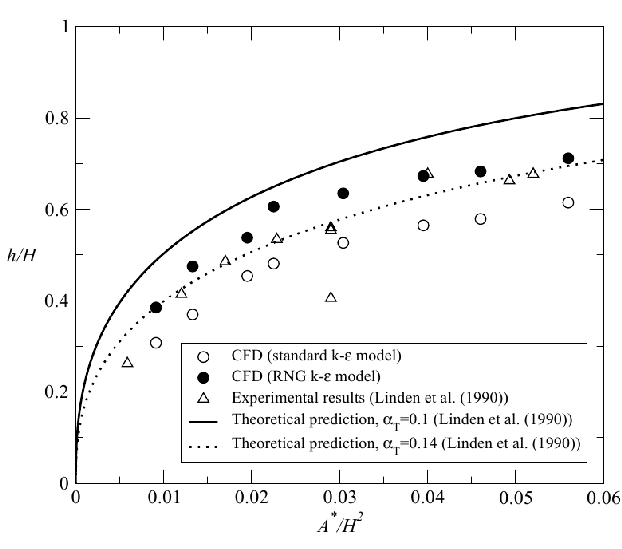
Figure 14. Measurements of interface height for 3D point-source plumes, compared with the theoretical model and salt-bath experiments of Linden et al. (1990). Theoretical curves for two different values of entrainment coefficient are shown: the typical value of α = 0.1 and the value inferred from the CFD measurements of α = 0.14. Note that no-virtual origin corrections have been made and Ct = Cb = 1.0. (From Cook 1998). Originals of all the figures in this UFR are in UFR4-09_Figures.pdf
First, in both cases discharge coefficient values of Ct= Cb = 1.0 were used in the formulae for A*, equation (1). These values are some way from the classical value of 0.61 for a sharp- edged orifice — a good approximation to the geometry of the openings in both the CFD and experiments. The reason for this choice was that in the work of Linden et al. (1990), measurements of draining flows indicated these values to be appropriate. However, more detailed investigation by Hunt & Linden (1999) has shown that, in fact, when allowance is made for the timescale for the draining flow to become established, values close to the classical value of 0.6 were determined. These values were used by Hunt & Linden (1999) who found much better agreement with experiment. Cook (1998) also called into question the appropriateness of using Ct = Cb = 1.0 and repeated the comparisons shown in Figures 13 and 14 with values of Ct = Cb = 0.61 and found improved agreement.
Note: Changing the values of Ct and Cb does not affect the form of the curves in Figures 3 and 4, since these parameters are embedded in the definition of A*. The affect of reducing the value of Ct and Cb is to shift the data points to the left, e.g. for Ct = Cb = CDto a new abscissa value CDA*.
Secondly, another source of uncertainty in comparing results with the theoretical model is that, strictly, the formulae only apply when a correction has been made for the virtual origin of the plume. Different types of plume source will have different associated virtual origin offsets. Hunt & Linden (1999) made a virtual origin correction when comparing their results with theory in addition to using revised values of Ct and Cb. Both effects led to improved agreement between experiment and theory. In the CFD model the thermal plume sources are nominally closer to being ideal than in the salt-bath experiments. However, through close examination of the buoyancy and volume fluxes in the plumes, Cook (1998) concluded that the plumes in the CFD simulations also had significant virtual origin offsets.
Thirdly, there is likely to be uncertainty regarding the exact value of the entrainment constant, α , to use in the theoretical curves, since this can vary from case to case. At present there is no methodology to determine the appropriate value of α , a priori, although values can be estimated once experimental or CFD data has been obtained.
Due to the issues discussed above, it is difficult to draw from comparisons of the type shown in Figures 13 and 14 firm conclusions regarding the relative accuracy of the two eddy-viscosity turbulence models used. In view of this, Cook (1998) investigated in more detail the volume flux and buoyancy profiles in the modelled plumes and also determined values of entrainment constants. These investigations indicated that the RNG k-ε model gave somewhat more accurate results than the "standard" k-ε model, which was generally over-diffusive.
The above comparisons between the salt-bath models and the work of Cook & Lomas (1997, 1998) and Cook (1998) has demonstrated that for the emptying-filling box flow, good agreement can be obtained by comparing simulations of full-scale air flow (without radiative heat transfer) with the appropriately non-dimensionalised results of the theoretical model and salt-bath experiments of Linden et al. (1990). This methodology provides an important validation scenario for the implementation of buoyancy and turbulence models in CFD simulation of buoyancy-driven flows in enclosed spaces. Best practice advice for the simulations of such flows arising from this work is summarized in the following section.
© copyright ERCOFTAC 2004
Contributors: Jake Hacker - Arup