UFR 2-03 Evaluation: Difference between revisions
(→Case 1) |
(→Case 2) |
||
| Line 39: | Line 39: | ||
=== Case 2 === | === Case 2 === | ||
In the Ref [12] (1996), the Navier-Stokes equations with a ''k-''ω turbulence model by Wilcox are solved using a staggered finite volume scheme. (Flow variables are calculated in cell centres but ''k'' and ω are defined in cell vertexes and use staggered volume). All fluxes include moving mesh velocity. Artificial dissipation of blend of second and fourth differences of the flow variables is used. It takes into account that the maximum eigenvalue used to scale dissipation must include the moving grid velocity. The discretisation in space is by the | In the Ref [12] (1996), the Navier-Stokes equations with a ''k-''ω turbulence model by Wilcox are solved using a staggered finite volume scheme. (Flow variables are calculated in cell centres but ''k'' and ω are defined in cell vertexes and use staggered volume). All fluxes include moving mesh velocity. Artificial dissipation of blend of second and fourth differences of the flow variables is used. It takes into account that the maximum eigenvalue used to scale dissipation must include the moving grid velocity. The discretisation in space is by the upwind–type scheme with Roe splitting which utilises second-order MUSCL interpolation. In time, the implicit multigrid scheme which is a version of the Jameson's [17] pseudo-time marching scheme for obtaining time accurate solution is implemented. | ||
The single block 257x65 C mesh was generated by a hyperbolic grid generator. The mesh is rigidly fixed to the aerofoil and moves with it. At every time instant the coordinates of the aerofoil and the grid coordinates and velocities are calculated according to the prescribed aerofoil pitching. The minimum grid size is 2x10<sup> | The single block 257x65 C mesh was generated by a hyperbolic grid generator. The mesh is rigidly fixed to the aerofoil and moves with it. At every time instant the coordinates of the aerofoil and the grid coordinates and velocities are calculated according to the prescribed aerofoil pitching. The minimum grid size is 2x10<sup>-5</sup> chord length, which corresponds to y+ of the order of 1.2 to 4.8 for the unsteady Navier-Stokes calculations. Four to five cycles were required for the flow to establish converged periodic solution (30 multigrid cycles were used within each implicit time step and 36 implicit time steps per cycle were required). Grid sensitivity study using the grid convergence index was performed for both space and time discretisation. | ||
No further information about initial and boundary conditions is available. | No further information about initial and boundary conditions is available. | ||
| Line 47: | Line 47: | ||
It is not known if this calculation was performed with fixed transition. | It is not known if this calculation was performed with fixed transition. | ||
Figure 5. Time histories of surface pressures [12]. | <center>[[Image:U2-03d32_files_image014.jpg]]</center> | ||
<center>''Figure 5. Time histories of surface pressures [12].''</center> | |||
(From F. Liu et al, Unsteady Flow Calculations with a Multigrid Navier-Stokes Method, AIAA Journal Vol. 34, No. 10, October 1996, p. 2047, used permission of the American Institute of Aeronautics and Astronautics, Inc.) | (From F. Liu et al, Unsteady Flow Calculations with a Multigrid Navier-Stokes Method, AIAA Journal Vol. 34, No. 10, October 1996, p. 2047, used permission of the American Institute of Aeronautics and Astronautics, Inc.) | ||
Figure 6. Comparison of computed C''<sub>l</sub>'' vs α with experimental data [12] | <center>[[Image:U2-03d32_files_image016.jpg]]</center> | ||
<center>Figure 6. Comparison of computed C''<sub>l</sub>'' vs α with experimental data [12]</center> | |||
(From F. Liu et al, Unsteady Flow Calculations with a Multigrid Navier-Stokes Method, AIAA Journal Vol. 34, No. 10, October 1996, p. 2047, used permission of the American Institute of Aeronautics and Astronautics, Inc.) | (From F. Liu et al, Unsteady Flow Calculations with a Multigrid Navier-Stokes Method, AIAA Journal Vol. 34, No. 10, October 1996, p. 2047, used permission of the American Institute of Aeronautics and Astronautics, Inc.) | ||
[[Image:U2-03d32_files_image018.jpg]] | [[Image:U2-03d32_files_image018.jpg]] | ||
Revision as of 13:12, 16 April 2010
Flow around oscillating airfoil
Underlying Flow Regime 2-03 © copyright ERCOFTAC 2004
Evaluation
CFD Simulations and Comparison with Experiments
Three readily accessible references have been chosen to show the representative efforts and status of CFD predictions for this case. In historical order these are: [11], [12] and [8] (pdf version available from Science Direct electronic journals). In all cases the steady-state was calculated first followed by oscillating aerofoil calculation until periodical flow was established.
Case 1
The first reference [11] (1981) is fundamental as it was a contribution from NASA AMES, and apart from reporting in a clear and concise manner a pioneering advanced CFD calculation for this example it is written jointly with S.S. Davis who was also involved in the experimental study. Of particular value is the data showing the experimental and computed shock locus as a function of the incidence angle. This graph is copied here in Fig. 4. The Ref [11], is also a good source of reference for the earlier work involving small disturbance equations and Euler solutions to this class of problems. (Note that the conditions used in this reference are very close but not identical to the ones considered here. In particular, M=0.8 and Re=12x106. This work was reported earlier than experiments in Ref. [6], and refers to experimental data in references [15,16]).
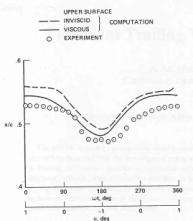
(From K.C.W.J. Chyu et al, Calculation of unsteady transonic flow over an aerofoil, AIAA Journal Vol. 19, No. 6, June 1981, p. 684, used permission of the American Institute of Aeronautics and Astronautics, Inc.)
The paper presents solutions of the thin layer Navier-Stokes equations by the algorithm described in detail (including accurancy and stability) in [13]. The algorithm uses an approximately factored implicit finite-difference scheme, similar to the one reported by Beam and Warming [14] and the Baldwin-Lomax turbulence model.
Non-slip boundary condition with zero velocities was imposed on the aerofoil. The pressure was determined from the normal momentum equation. The far field boundaries of the grid were held fixed in space and time, while the aerofoil position varied in time.
The Poisson equation based mesh generator was used with control of point clustering giving a single bloc 87x41 C- mesh. (Information about grid clustering near the wall is not available). To avoid mesh regeneration in every iteration, the grid was generated in extreme positions, and the intermediate meshes were found by interpolation along the circular arcs that were assumed to represent the locus of grid point movement. The outer boundary was located at 8 chord lenghts upstream and downstream from the aerofoil leading edge. The computation was initiated at alpha 1 deg and required two cycles of oscillation to reach the established periodic solution (1800 iterations per cycle).
Computed were shock-wave excursion shown in Fig. 4 and time histories of surface pressure. The angle of attack varied from -1 deg to 1 deg. Comparison with experiments showed that the computed pressures ahead of the upper surface shock were underpredicted, but in the shock wave region the pressure rises were predicted better. The trend of the excursion of the shock was well predicted. The pressure distributions downstream of the shock were predicted well and proved to be insensitive to viscous effects, as for this case there is no flow separation. Fourier analysis using pressure coefficients indicated that pressure coefficients ahead and behind the shock vary sinusoidaly, but in a shock region the variations are non-linear. Comparison with inviscid calculations concluded that the effects of shock-boundary interaction must be taken into account to accurately model the shock position. This in turn influences the accuracy of prediction of lift and to much higher degree pitching moment time histeresis. It is not known if this calculation was performed with fixed transition.
Case 2
In the Ref [12] (1996), the Navier-Stokes equations with a k-ω turbulence model by Wilcox are solved using a staggered finite volume scheme. (Flow variables are calculated in cell centres but k and ω are defined in cell vertexes and use staggered volume). All fluxes include moving mesh velocity. Artificial dissipation of blend of second and fourth differences of the flow variables is used. It takes into account that the maximum eigenvalue used to scale dissipation must include the moving grid velocity. The discretisation in space is by the upwind–type scheme with Roe splitting which utilises second-order MUSCL interpolation. In time, the implicit multigrid scheme which is a version of the Jameson's [17] pseudo-time marching scheme for obtaining time accurate solution is implemented.
The single block 257x65 C mesh was generated by a hyperbolic grid generator. The mesh is rigidly fixed to the aerofoil and moves with it. At every time instant the coordinates of the aerofoil and the grid coordinates and velocities are calculated according to the prescribed aerofoil pitching. The minimum grid size is 2x10⁻⁵ chord length, which corresponds to y+ of the order of 1.2 to 4.8 for the unsteady Navier-Stokes calculations. Four to five cycles were required for the flow to establish converged periodic solution (30 multigrid cycles were used within each implicit time step and 36 implicit time steps per cycle were required). Grid sensitivity study using the grid convergence index was performed for both space and time discretisation.
No further information about initial and boundary conditions is available.
It is not known if this calculation was performed with fixed transition.
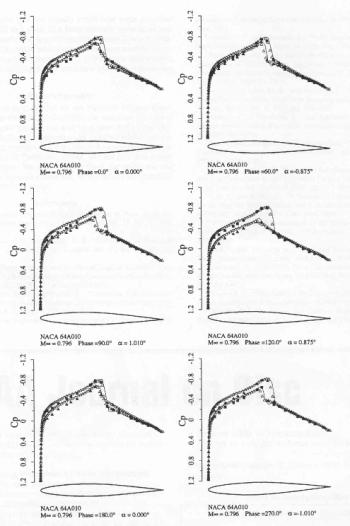
(From F. Liu et al, Unsteady Flow Calculations with a Multigrid Navier-Stokes Method, AIAA Journal Vol. 34, No. 10, October 1996, p. 2047, used permission of the American Institute of Aeronautics and Astronautics, Inc.)
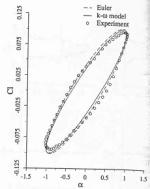
(From F. Liu et al, Unsteady Flow Calculations with a Multigrid Navier-Stokes Method, AIAA Journal Vol. 34, No. 10, October 1996, p. 2047, used permission of the American Institute of Aeronautics and Astronautics, Inc.)
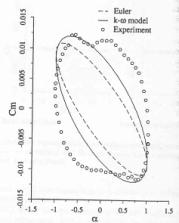
Figure 7. Comparison of computed Cm vs α with experimental data [12].
(From F. Liu et al, Unsteady Flow Calculations with a Multigrid Navier-Stokes Method, AIAA Journal Vol. 34, No. 10, October 1996, p. 2047, used permission of the American Institute of Aeronautics and Astronautics, Inc.)
Fig .5, copied from ref [12], shows the calculated pressure coefficient compared to experiment at different phase angle. The agreement was good for the inviscid solution and only moderately improved for the viscous solution. This indicates that for cases without separation Cp plots are not sufficient to judge the influence of viscous effects. Figures 6 and 7 (from ref [12]) show the lift coefficient versus angle of attack and the moment coefficient versus angle of attack respectively. Although, there is a good agreement with experiment for lift coefficient histeresis, the calculation misses two pocket like distributions of the experimental data between the maximum and minimum angles of attack. It is speculated in ref.[12], that this is due to the accuracy of modelling of the shock/boundary layer interaction, which affects significantly the shock location and in turn the moment. This appears to be consistent with comments in the previous reference [11].
Case 3
Finally in the reference [8] (1999), Baldwin-Lomax, Spalart-Allmars and Laudner-Sharma are additionally tested. The Navier-Stokes equations together with the turbulent transport equations model are solved in a strongly coupled manner by a finite volume method which is an extension to unsteady flows of the implicit, unfactored relaxation method [18,19]. The discretisation of the inviscid fluxes is obtained by a third order upwind characteristic-based scheme. The viscous terms are discretised by central differences. Nonlinearity of the flux vector is resolved by the Newton-type subiterations. For the unsteady flows the model by Fan, Lakshminarayana and Barnett (FLB), [20] is used complementary to the Lauder-Shrama model. In the model, parameter y+ is not employed in the near wall region, but instead the turbulent Reynolds number or near-wall Reynolds number are used. See [8] and [20] for discussion.
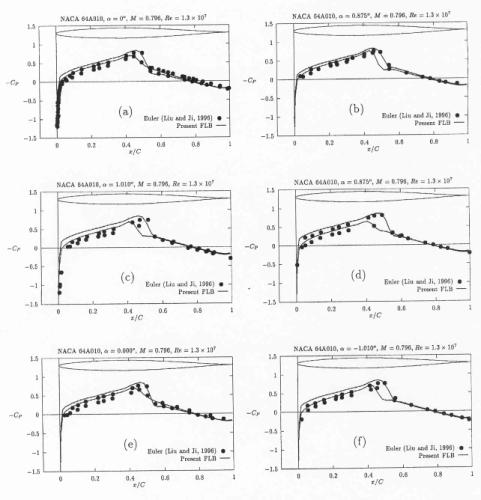
Figure 8. Time histories of surface pressure coefficient distribution for the NACA-64A010 oscillating aerofoil [18] (M∞ = 0.796, Re = 1.3 x 10⁷, f* = 0.202, α0 = 0°, α1 = 1.01°).
(From: Implicit-unfactored implementation of two-equation turbulence models in Compressible Navier-Stokes methods, G. Barakos and D. Drikakis, International Journal Numerical Methods in Fluids 1998, Vol. 28, p. 73, Copyright John Wiley & Sons Limited. Reproduced with permission.)
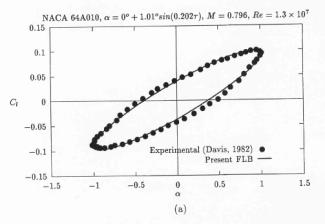
Figure 9 [18].
(From: Implicit-unfactored implementation of two-equation turbulence models in Compressible Navier-Stokes methods, G. Barakos and D. Drikakis, International Journal Numerical Methods in Fluids 1998, Vol. 28, p. 73, Copyright John Wiley & Sons Limited. Reproduced with permission.)
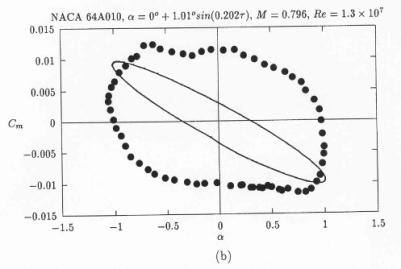
Figure 10 [18].
(From: Implicit-unfactored implementation of two-equation turbulence models in Compressible Navier-Stokes methods, G. Barakos and D. Drikakis, International Journal Numerical Methods in Fluids 1998, Vol. 28, p. 73, Copyright John Wiley & Sons Limited. Reproduced with permission.)
In Fig. 8, taken from ref. [8], the calculated pressure coefficient is compared with experiment and inviscid solution from ref [12]. The quality of solution appears to be similar to that presented in ref [12] for viscous results. Following the same trend, as in ref [12], the lift coefficient versus angle of attack Fig. 9 (from ref. [8]), shows good agreement with experiment, but, the moment coefficient versus angle of attack histeresis, Fig. 10 (from ref. [8]) still does not reflect the shape obtained from experimental measurements. The flow converged to the periodical flow in 4 cycles and 105 Newton-type subiterations were needed to complete one cycle. The norm and the convergence history for this case can be found on pp 917,918 in ref [8]. No further information is available about mesh quality and generation or about boundary and initial conditions. It is not known if this calculation was performed with fixed transition.
© copyright ERCOFTAC 2004
Contributors: Joanna Szmelter - Cranfield University
