EXP 1-2 Experimental Set Up: Difference between revisions
Stepan.Nosek (talk | contribs) |
Stepan.Nosek (talk | contribs) |
||
| Line 16: | Line 16: | ||
==Atmospheric Boundary Layer parameters== | ==Atmospheric Boundary Layer parameters== | ||
The properties of the boundary layer were measured at the wind tunnel free-stream velocity <i>U<sub>ref</sub></i> = 6.2 m s<sup>-1</sup> (measured with a Prandtl tube at a fixed position, 1 m above the wind tunnel floor and 4 m upwind from the test section) using 2D laser Doppler anemometry (LDA) at four positions between the roughness elements at the end of the development section. The position and characteristics of the best-fit vertical profile are presented in [[#figure6|Fig 6a]] and [[#figure6|b]], respectively (see also [[Lib:EXP 1-2 Description|Fig. 2 in Description section]]). The main aerodynamic parameters of the simulated boundary layer were the roughness length, <i>z<sub>0</sub></i> = 1.87 m; displacement height, <i>d<sub>0</sub></i> = 3 m; and friction velocity, <i>u<sub>*</sub></i> = 0.43 m s<sup>-1</sup>, all at full scale and turbulence characteristics of turbulence. The | The properties of the boundary layer were measured at the wind tunnel free-stream velocity <i>U<sub>ref</sub></i> = 6.2 m s<sup>-1</sup> (measured with a Prandtl tube at a fixed position, 1 m above the wind tunnel floor and 4 m upwind from the test section) using 2D laser Doppler anemometry (LDA) at four positions between the roughness elements at the end of the development section. The position and characteristics of the best-fit vertical profile are presented in [[#figure6|Fig 6a]] and [[#figure6|b]], respectively (see also [[Lib:EXP 1-2 Description|Fig. 2 in Description section]]). The main aerodynamic parameters of the simulated boundary layer were the roughness length, <i>z<sub>0</sub></i> = 1.87 m; displacement height, <i>d<sub>0</sub></i> = 3 m; and friction velocity, <i>u<sub>*</sub></i> = 0.43 m s<sup>-1</sup>, all at full scale and turbulence characteristics of turbulence. These parameters were obtained by fitting of the data by a logarithmic law, while the power exponent (a = 0.27) was obtained by a power law. The streamwise (<i>I<sub>u</sub></i>) and vertical (<i>I<sub>w</sub></i>) intensity of turbulence were in accordance with the guidelines of [https://www.vdi.de/en/home/vdi-standards/details/vdi-3783-blatt-12-environmental-meteorology-physical-modelling-of-flow-and-dispersion-processes-in-the-atmospheric-boundary-layer-application-of-wind-tunnels-1 VDI (2000)]. We also calculated the integral length scales of the streamwise velocity component, <i>L<sub>u,x</sub></i>, from time series measured at 7 different heights across the boundary layer depth. [[#figure7|Fig 7]] shows that for heights <i>z<sub>FS</sub></i> < 50 m (full scale), these integral length scales were within the theoretical values for very rough terrain and in good agreement with the in-situ measurements [https://doi.org/10.1016/0004-6981(75)90088-8 (Counihan, 1975)]. | ||
Revision as of 14:51, 22 June 2023
Pollutant transport between a street canyon and a 3D urban array as a function of wind direction and roof height non-uniformity
Experimental Setup
Wind tunnel
The experiments were conducted under neutrally stratified conditions in the Environmental wind tunnel of the Institute of Thermomechanics of the Czech Academy of Sciences in Nový Knín (Fig 5). It is an open low-velocity wind tunnel with cross dimensions of 1.5 × 1.5 m, the lengths of the development and test sections being 20.5 m and 2 m, respectively. The freestream velocity can be maintained within a range of 0.1-10 m s-1 by means of a frequency convertor of the fan with an accuracy of 0.05 m-1 by using a frequency converter of the fan. Since pollutant dispersion in urban areas is related to the atmospheric boundary layer developing over a terrain with such roughness, the corresponding approaching boundary layer was introduced at a scale of 1:400 by turbulence generators (a set of three spires, 1.4 m heigh) and then developed by a staggered arrangement of roughness elements (thin plates with a width and height of 50 mm) along the remaining part of the development section in the wind tunnel (see Fig 2).
Atmospheric Boundary Layer parameters
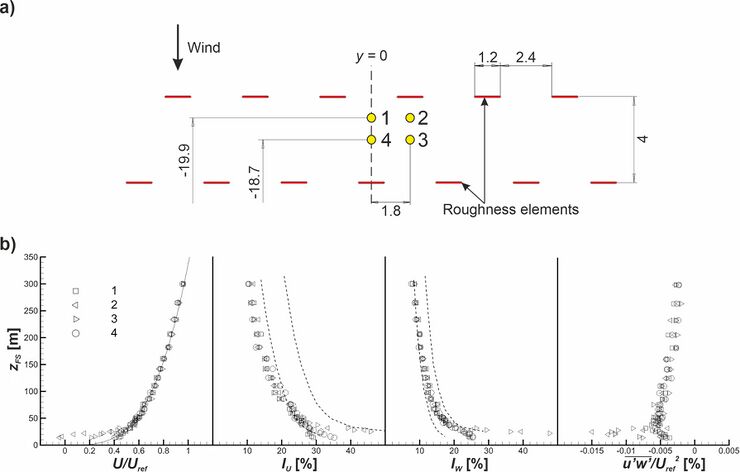
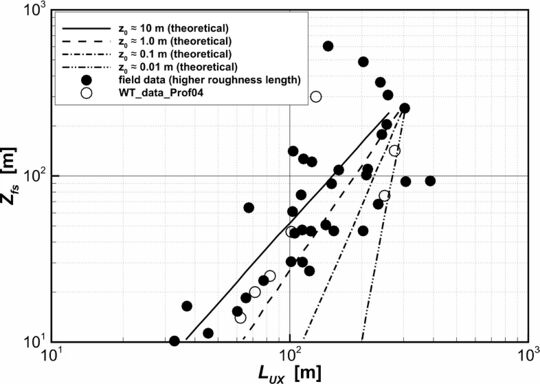
The properties of the boundary layer were measured at the wind tunnel free-stream velocity Uref = 6.2 m s-1 (measured with a Prandtl tube at a fixed position, 1 m above the wind tunnel floor and 4 m upwind from the test section) using 2D laser Doppler anemometry (LDA) at four positions between the roughness elements at the end of the development section. The position and characteristics of the best-fit vertical profile are presented in Fig 6a and b, respectively (see also Fig. 2 in Description section). The main aerodynamic parameters of the simulated boundary layer were the roughness length, z0 = 1.87 m; displacement height, d0 = 3 m; and friction velocity, u* = 0.43 m s-1, all at full scale and turbulence characteristics of turbulence. These parameters were obtained by fitting of the data by a logarithmic law, while the power exponent (a = 0.27) was obtained by a power law. The streamwise (Iu) and vertical (Iw) intensity of turbulence were in accordance with the guidelines of VDI (2000). We also calculated the integral length scales of the streamwise velocity component, Lu,x, from time series measured at 7 different heights across the boundary layer depth. Fig 7 shows that for heights zFS < 50 m (full scale), these integral length scales were within the theoretical values for very rough terrain and in good agreement with the in-situ measurements (Counihan, 1975).

.

Ground-level line source
Pollution from traffic was simulated by a ground-level line source that uniformly emitted a passive gas (ethane). Since the actual traffic flow on the roads is uneven due to acceleration and deceleration at intersections, our goal was to minimise the input parameters that could affect the observation of pollution dispersion in the immediate environment. The line source was 1 m long and consisted of 504 uniformly spaced stainless steel tubes arranged continuously side by side along the lower centreline of the studied street canyons and adjacent intersections. These tubes had an internal diameter of 0.3 mm and a length of 100 mm and were installed in the plenum chamber below the wind tunnel floor. Consequently, the entire length of the tubes remained below the floor level of the urban array models, with the outlets aligned accordingly. The pressure difference between the plenum chamber and the wind tunnel floor was adjusted to ensure a gas flow rate of 18 ml s-1 over the entire length of the source, which was not affected by local pressure fluctuations in the street canyon. Before the measurement campaign, various tests were carried out to check the homogeneity of the line source and to assess the influence of the ethane outlet velocity on the flow in the street canyon, using both measurement techniques and visualisations.
Contributed by: Štěpán Nosek — Institute of Thermomechanics of the CAS, v. v. i.
© copyright ERCOFTAC 2024
